
Advertisement
- Taiwan
- /
- Electrical
- /
- TPEX:4549
Is FineTek Co., Ltd.'s (GTSM:4549) Recent Performance Tethered To Its Attractive Financial Prospects?
Most readers would already know that FineTek's (GTSM:4549) stock increased by 2.5% over the past week. Since the market usually pay for a company’s long-term financial health, we decided to study the company’s fundamentals to see if they could be influencing the market. Specifically, we decided to study FineTek's ROE in this article.
Return on equity or ROE is a key measure used to assess how efficiently a company's management is utilizing the company's capital. In other words, it is a profitability ratio which measures the rate of return on the capital provided by the company's shareholders.
View our latest analysis for FineTek
How Is ROE Calculated?
The formula for ROE is:
Return on Equity = Net Profit (from continuing operations) ÷ Shareholders' Equity
So, based on the above formula, the ROE for FineTek is:
16% = NT$214m ÷ NT$1.4b (Based on the trailing twelve months to September 2020).
The 'return' is the income the business earned over the last year. That means that for every NT$1 worth of shareholders' equity, the company generated NT$0.16 in profit.
What Has ROE Got To Do With Earnings Growth?
We have already established that ROE serves as an efficient profit-generating gauge for a company's future earnings. Based on how much of its profits the company chooses to reinvest or "retain", we are then able to evaluate a company's future ability to generate profits. Assuming all else is equal, companies that have both a higher return on equity and higher profit retention are usually the ones that have a higher growth rate when compared to companies that don't have the same features.
A Side By Side comparison of FineTek's Earnings Growth And 16% ROE
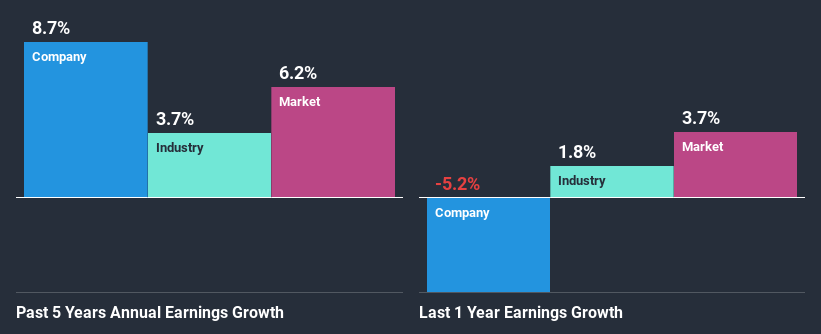
At first glance, FineTek seems to have a decent ROE. On comparing with the average industry ROE of 7.9% the company's ROE looks pretty remarkable. This probably laid the ground for FineTek's moderate 8.7% net income growth seen over the past five years.
As a next step, we compared FineTek's net income growth with the industry, and pleasingly, we found that the growth seen by the company is higher than the average industry growth of 3.7%.
Earnings growth is an important metric to consider when valuing a stock. What investors need to determine next is if the expected earnings growth, or the lack of it, is already built into the share price. Doing so will help them establish if the stock's future looks promising or ominous. If you're wondering about FineTek's's valuation, check out this gauge of its price-to-earnings ratio, as compared to its industry.
Is FineTek Using Its Retained Earnings Effectively?
The high three-year median payout ratio of 77% (or a retention ratio of 23%) for FineTek suggests that the company's growth wasn't really hampered despite it returning most of its income to its shareholders.
Moreover, FineTek is determined to keep sharing its profits with shareholders which we infer from its long history of seven years of paying a dividend.
Summary
On the whole, we feel that FineTek's performance has been quite good. We are particularly impressed by the considerable earnings growth posted by the company, which was likely backed by its high ROE. While the company is paying out most of its earnings as dividends, it has been able to grow its earnings in spite of it, so that's probably a good sign. So far, we've only made a quick discussion around the company's earnings growth. So it may be worth checking this free detailed graph of FineTek's past earnings, as well as revenue and cash flows to get a deeper insight into the company's performance.
If you decide to trade FineTek, use the lowest-cost* platform that is rated #1 Overall by Barron’s, Interactive Brokers. Trade stocks, options, futures, forex, bonds and funds on 135 markets, all from a single integrated account. Promoted
New: AI Stock Screener & Alerts
Our new AI Stock Screener scans the market every day to uncover opportunities.
• Dividend Powerhouses (3%+ Yield)
• Undervalued Small Caps with Insider Buying
• High growth Tech and AI Companies
Or build your own from over 50 metrics.
This article by Simply Wall St is general in nature. It does not constitute a recommendation to buy or sell any stock, and does not take account of your objectives, or your financial situation. We aim to bring you long-term focused analysis driven by fundamental data. Note that our analysis may not factor in the latest price-sensitive company announcements or qualitative material. Simply Wall St has no position in any stocks mentioned.
*Interactive Brokers Rated Lowest Cost Broker by StockBrokers.com Annual Online Review 2020
Have feedback on this article? Concerned about the content? Get in touch with us directly. Alternatively, email editorial-team@simplywallst.com.
About TPEX:4549
FineTek
Manufactures and sells various industrial sensors in Taiwan and internationally.
Excellent balance sheet with questionable track record.
Market Insights

Advertisement
Community Narratives
The "Molecular Pencil": Why Beam's Technology is Built to Win
Fair Value US$65.01|65.4% undervalued
DA
Community Contributor
The silent giant behind virtually every advanced chip powering AI, smartphones, and modern infrastructure.
Fair Value US$310.00|6.1% undervalued
OS
Community Contributor
ADP Stock: Solid Fundamentals, But AI Investments Test Its Margin Resilience
Fair Value US$387.77|34.2% undervalued
YI
Community Contributor
MINISO's fair value is projected at 26.69 with an anticipated PE ratio shift of 20x
Fair Value US$24.03|9.6% undervalued
BE
Community Contributor