Does Sumeeko Industries Co., Ltd.'s (GTSM:2066) Weak Fundamentals Mean That The Market Could Correct Its Share Price?


Sumeeko Industries' (GTSM:2066) stock is up by a considerable 16% over the past month. However, we decided to pay close attention to its weak financials as we are doubtful that the current momentum will keep up, given the scenario. Particularly, we will be paying attention to Sumeeko Industries' ROE today.
Return on equity or ROE is an important factor to be considered by a shareholder because it tells them how effectively their capital is being reinvested. In short, ROE shows the profit each dollar generates with respect to its shareholder investments.
See our latest analysis for Sumeeko Industries
How To Calculate Return On Equity?
Return on equity can be calculated by using the formula:
Return on Equity = Net Profit (from continuing operations) ÷ Shareholders' Equity
So, based on the above formula, the ROE for Sumeeko Industries is:
1.0% = NT$11m ÷ NT$1.1b (Based on the trailing twelve months to September 2020).
The 'return' is the amount earned after tax over the last twelve months. One way to conceptualize this is that for each NT$1 of shareholders' capital it has, the company made NT$0.01 in profit.
What Has ROE Got To Do With Earnings Growth?
Thus far, we have learned that ROE measures how efficiently a company is generating its profits. Based on how much of its profits the company chooses to reinvest or "retain", we are then able to evaluate a company's future ability to generate profits. Assuming all else is equal, companies that have both a higher return on equity and higher profit retention are usually the ones that have a higher growth rate when compared to companies that don't have the same features.
A Side By Side comparison of Sumeeko Industries' Earnings Growth And 1.0% ROE
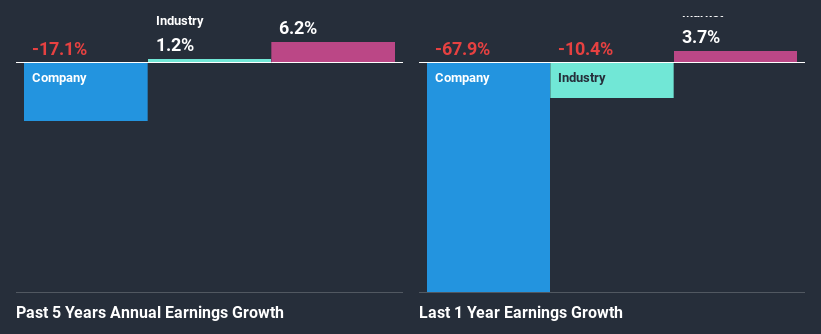
As you can see, Sumeeko Industries' ROE looks pretty weak. Even compared to the average industry ROE of 9.8%, the company's ROE is quite dismal. Given the circumstances, the significant decline in net income by 17% seen by Sumeeko Industries over the last five years is not surprising. We believe that there also might be other aspects that are negatively influencing the company's earnings prospects. Such as - low earnings retention or poor allocation of capital.
However, when we compared Sumeeko Industries' growth with the industry we found that while the company's earnings have been shrinking, the industry has seen an earnings growth of 1.2% in the same period. This is quite worrisome.
The basis for attaching value to a company is, to a great extent, tied to its earnings growth. The investor should try to establish if the expected growth or decline in earnings, whichever the case may be, is priced in. By doing so, they will have an idea if the stock is headed into clear blue waters or if swampy waters await. If you're wondering about Sumeeko Industries''s valuation, check out this gauge of its price-to-earnings ratio, as compared to its industry.
Is Sumeeko Industries Using Its Retained Earnings Effectively?
With a high three-year median payout ratio of 65% (implying that 35% of the profits are retained), most of Sumeeko Industries' profits are being paid to shareholders, which explains the company's shrinking earnings. With only a little being reinvested into the business, earnings growth would obviously be low or non-existent. Our risks dashboard should have the 5 risks we have identified for Sumeeko Industries.
Additionally, Sumeeko Industries has paid dividends over a period of nine years, which means that the company's management is rather focused on keeping up its dividend payments, regardless of the shrinking earnings.
Conclusion
On the whole, Sumeeko Industries' performance is quite a big let-down. The company has seen a lack of earnings growth as a result of retaining very little profits and whatever little it does retain, is being reinvested at a very low rate of return. Up till now, we've only made a short study of the company's growth data. You can do your own research on Sumeeko Industries and see how it has performed in the past by looking at this FREE detailed graph of past earnings, revenue and cash flows.
When trading Sumeeko Industries or any other investment, use the platform considered by many to be the Professional's Gateway to the Worlds Market, Interactive Brokers. You get the lowest-cost* trading on stocks, options, futures, forex, bonds and funds worldwide from a single integrated account. Promoted
New: Manage All Your Stock Portfolios in One Place
We've created the ultimate portfolio companion for stock investors, and it's free.
• Connect an unlimited number of Portfolios and see your total in one currency
• Be alerted to new Warning Signs or Risks via email or mobile
• Track the Fair Value of your stocks
This article by Simply Wall St is general in nature. It does not constitute a recommendation to buy or sell any stock, and does not take account of your objectives, or your financial situation. We aim to bring you long-term focused analysis driven by fundamental data. Note that our analysis may not factor in the latest price-sensitive company announcements or qualitative material. Simply Wall St has no position in any stocks mentioned.
*Interactive Brokers Rated Lowest Cost Broker by StockBrokers.com Annual Online Review 2020
Have feedback on this article? Concerned about the content? Get in touch with us directly. Alternatively, email editorial-team@simplywallst.com.
About TPEX:2066
Flawless balance sheet with acceptable track record.
