- Singapore
- /
- Infrastructure
- /
- SGX:S58
SATS' (SGX:S58) earnings have declined over five years, contributing to shareholders 46% loss

In order to justify the effort of selecting individual stocks, it's worth striving to beat the returns from a market index fund. But the main game is to find enough winners to more than offset the losers At this point some shareholders may be questioning their investment in SATS Ltd. (SGX:S58), since the last five years saw the share price fall 51%.
On a more encouraging note the company has added S$134m to its market cap in just the last 7 days, so let's see if we can determine what's driven the five-year loss for shareholders.
See our latest analysis for SATS
While SATS made a small profit, in the last year, we think that the market is probably more focussed on the top line growth at the moment. Generally speaking, we'd consider a stock like this alongside loss-making companies, simply because the quantum of the profit is so low. For shareholders to have confidence a company will grow profits significantly, it must grow revenue.
In the last half decade, SATS saw its revenue increase by 11% per year. That's a pretty good rate for a long time period. The share price return isn't so respectable with an annual loss of 9% over the period. That suggests the market is disappointed with the current growth rate. That could lead to an opportunity if the company is going to become profitable sooner rather than later.
The company's revenue and earnings (over time) are depicted in the image below (click to see the exact numbers).
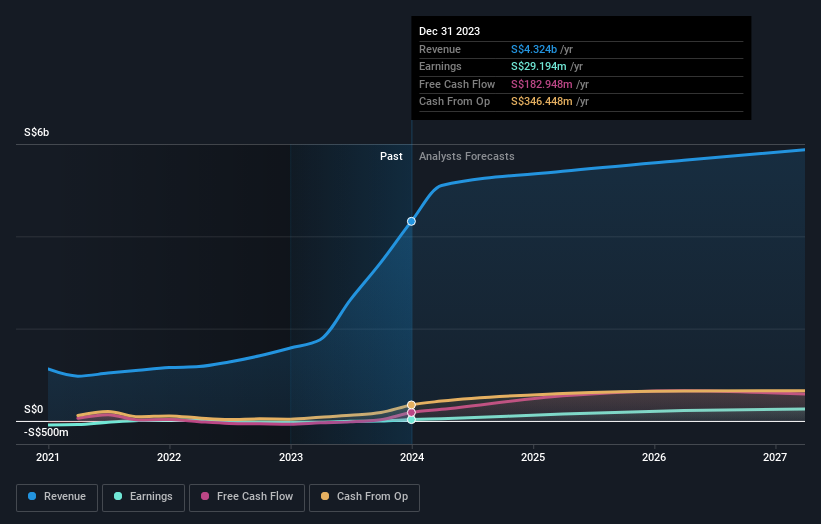
We know that SATS has improved its bottom line over the last three years, but what does the future have in store? You can see how its balance sheet has strengthened (or weakened) over time in this free interactive graphic.
What About The Total Shareholder Return (TSR)?
We'd be remiss not to mention the difference between SATS' total shareholder return (TSR) and its share price return. Arguably the TSR is a more complete return calculation because it accounts for the value of dividends (as if they were reinvested), along with the hypothetical value of any discounted capital that have been offered to shareholders. SATS' TSR of was a loss of 46% for the 5 years. That wasn't as bad as its share price return, because it has paid dividends.
A Different Perspective
SATS shareholders are down 6.8% for the year, but the market itself is up 0.1%. Even the share prices of good stocks drop sometimes, but we want to see improvements in the fundamental metrics of a business, before getting too interested. Unfortunately, longer term shareholders are suffering worse, given the loss of 8% doled out over the last five years. We'd need to see some sustained improvements in the key metrics before we could muster much enthusiasm. I find it very interesting to look at share price over the long term as a proxy for business performance. But to truly gain insight, we need to consider other information, too. For example, we've discovered 2 warning signs for SATS (1 is significant!) that you should be aware of before investing here.
For those who like to find winning investments this free list of growing companies with recent insider purchasing, could be just the ticket.
Please note, the market returns quoted in this article reflect the market weighted average returns of stocks that currently trade on Singaporean exchanges.
New: Manage All Your Stock Portfolios in One Place
We've created the ultimate portfolio companion for stock investors, and it's free.
• Connect an unlimited number of Portfolios and see your total in one currency
• Be alerted to new Warning Signs or Risks via email or mobile
• Track the Fair Value of your stocks
Have feedback on this article? Concerned about the content? Get in touch with us directly. Alternatively, email editorial-team (at) simplywallst.com.
This article by Simply Wall St is general in nature. We provide commentary based on historical data and analyst forecasts only using an unbiased methodology and our articles are not intended to be financial advice. It does not constitute a recommendation to buy or sell any stock, and does not take account of your objectives, or your financial situation. We aim to bring you long-term focused analysis driven by fundamental data. Note that our analysis may not factor in the latest price-sensitive company announcements or qualitative material. Simply Wall St has no position in any stocks mentioned.
About SGX:S58
SATS
An investment holding company, provides gateway services and food solutions in Singapore, Asia Pacific, the United States, Europe, Middle East, Africa, and internationally.
Moderate growth potential with questionable track record.

