
Advertisement
- Singapore
- /
- Retail Distributors
- /
- SGX:O08
Ossia International (SGX:O08) Might Have The Makings Of A Multi-Bagger
To find a multi-bagger stock, what are the underlying trends we should look for in a business? In a perfect world, we'd like to see a company investing more capital into its business and ideally the returns earned from that capital are also increasing. This shows us that it's a compounding machine, able to continually reinvest its earnings back into the business and generate higher returns. With that in mind, we've noticed some promising trends at Ossia International (SGX:O08) so let's look a bit deeper.
Understanding Return On Capital Employed (ROCE)
For those that aren't sure what ROCE is, it measures the amount of pre-tax profits a company can generate from the capital employed in its business. Analysts use this formula to calculate it for Ossia International:
Return on Capital Employed = Earnings Before Interest and Tax (EBIT) ÷ (Total Assets - Current Liabilities)
0.061 = S$3.0m ÷ (S$56m - S$6.6m) (Based on the trailing twelve months to September 2022).
So, Ossia International has an ROCE of 6.1%. On its own, that's a low figure but it's around the 5.2% average generated by the Retail Distributors industry.
Check out our latest analysis for Ossia International
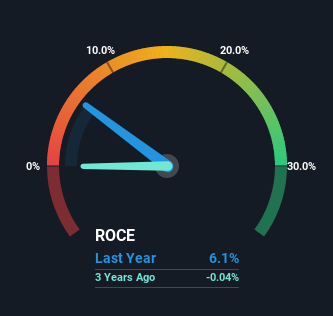
Historical performance is a great place to start when researching a stock so above you can see the gauge for Ossia International's ROCE against it's prior returns. If you want to delve into the historical earnings, revenue and cash flow of Ossia International, check out these free graphs here.
So How Is Ossia International's ROCE Trending?
The fact that Ossia International is now generating some pre-tax profits from its prior investments is very encouraging. The company was generating losses five years ago, but now it's earning 6.1% which is a sight for sore eyes. In addition to that, Ossia International is employing 42% more capital than previously which is expected of a company that's trying to break into profitability. This can tell us that the company has plenty of reinvestment opportunities that are able to generate higher returns.
On a related note, the company's ratio of current liabilities to total assets has decreased to 12%, which basically reduces it's funding from the likes of short-term creditors or suppliers. So this improvement in ROCE has come from the business' underlying economics, which is great to see.
The Key Takeaway
To the delight of most shareholders, Ossia International has now broken into profitability. And investors seem to expect more of this going forward, since the stock has rewarded shareholders with a 92% return over the last five years. So given the stock has proven it has promising trends, it's worth researching the company further to see if these trends are likely to persist.
Ossia International does come with some risks though, we found 4 warning signs in our investment analysis, and 2 of those make us uncomfortable...
While Ossia International may not currently earn the highest returns, we've compiled a list of companies that currently earn more than 25% return on equity. Check out this free list here.
New: AI Stock Screener & Alerts
Our new AI Stock Screener scans the market every day to uncover opportunities.
• Dividend Powerhouses (3%+ Yield)
• Undervalued Small Caps with Insider Buying
• High growth Tech and AI Companies
Or build your own from over 50 metrics.
Have feedback on this article? Concerned about the content? Get in touch with us directly. Alternatively, email editorial-team (at) simplywallst.com.
This article by Simply Wall St is general in nature. We provide commentary based on historical data and analyst forecasts only using an unbiased methodology and our articles are not intended to be financial advice. It does not constitute a recommendation to buy or sell any stock, and does not take account of your objectives, or your financial situation. We aim to bring you long-term focused analysis driven by fundamental data. Note that our analysis may not factor in the latest price-sensitive company announcements or qualitative material. Simply Wall St has no position in any stocks mentioned.
About SGX:O08
Ossia International
An investment holding company, distributes and retails lifestyle, outdoors, luggage, and accessories products in Taiwan.
Flawless balance sheet and good value.
Market Insights

Advertisement
Weekly Picks
RO


RockeTeller on Santacruz Silver Mining ·
Crazy Undervalued 42 Baggers Silver Play (Active & Running Mine)
Fair Value:CA$8696.4% undervalued
39 followersusers have followed this narrative
6 commentsusers have commented on this narrative
11 likesusers have liked this narrative
RO


Robbo on Fiducian Group ·
Fiducian: Compliance Clouds or Value Opportunity?
Fair Value:AU$123.8% undervalued
4 followersusers have followed this narrative
0 commentsusers have commented on this narrative
0 likesusers have liked this narrative
WO

woodworthfund on Willamette Valley Vineyards ·
Willamette Valley Vineyards (WVVI): Not-So-Great Value
Fair Value:US$244.5% overvalued
6 followersusers have followed this narrative
0 commentsusers have commented on this narrative
1 likeusers have liked this narrative
Recently Updated Narratives
FU

FundamentallySarcastic on Credit Corp Group ·
Moderation and Stabilisation: HOLD: Fair Price based on a 4-year Cycle is $12.08
Fair Value:AU$12.6411.8% overvalued
2 followersusers have followed this narrative
0 commentsusers have commented on this narrative
0 likesusers have liked this narrative
MA


MarkoVT on Alphabet ·
Positioned globally, partnered locally
Fair Value:US$390.1918.1% undervalued
4 followersusers have followed this narrative
0 commentsusers have commented on this narrative
0 likesusers have liked this narrative
JO


JohnJ on Worldline ·
When will fraudsters be investigated in depth. Fraud was ongoing in France too.
Fair Value:€0.5190.0% overvalued
2 followersusers have followed this narrative
0 commentsusers have commented on this narrative
0 likesusers have liked this narrative
Popular Narratives
TH


TheWallstreetKing on MicroVision ·
MicroVision will explode future revenue by 380.37% with a vision towards success
Fair Value:US$6098.5% undervalued
114 followersusers have followed this narrative
11 commentsusers have commented on this narrative
22 likesusers have liked this narrative
AN


AnalystConsensusTarget on NVIDIA ·
NVDA: Expanding AI Demand Will Drive Major Data Center Investments Through 2026
Fair Value:US$250.3928.3% undervalued
952 followersusers have followed this narrative
6 commentsusers have commented on this narrative
25 likesusers have liked this narrative
OS

oscargarcia on Alphabet ·
The company that turned a verb into a global necessity and basically runs the modern internet, digital ads, smartphones, maps, and AI.
Fair Value:US$3406.0% undervalued
147 followersusers have followed this narrative
6 commentsusers have commented on this narrative
18 likesusers have liked this narrative

