- Singapore
- /
- Real Estate
- /
- SGX:Z25
Yanlord Land Group Limited (SGX:Z25) Held Back By Insufficient Growth Even After Shares Climb 45%


The Yanlord Land Group Limited (SGX:Z25) share price has done very well over the last month, posting an excellent gain of 45%. Not all shareholders will be feeling jubilant, since the share price is still down a very disappointing 11% in the last twelve months.
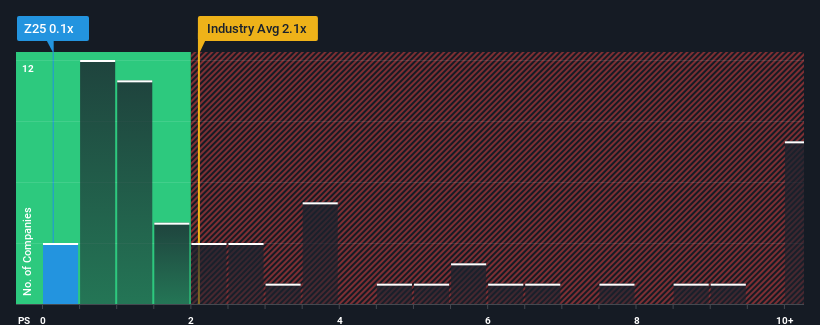
Even after such a large jump in price, Yanlord Land Group's price-to-sales (or "P/S") ratio of 0.1x might still make it look like a buy right now compared to the Real Estate industry in Singapore, where around half of the companies have P/S ratios above 2.1x and even P/S above 6x are quite common. Although, it's not wise to just take the P/S at face value as there may be an explanation why it's limited.
See our latest analysis for Yanlord Land Group
What Does Yanlord Land Group's Recent Performance Look Like?
Yanlord Land Group certainly has been doing a good job lately as it's been growing revenue more than most other companies. It might be that many expect the strong revenue performance to degrade substantially, which has repressed the share price, and thus the P/S ratio. If not, then existing shareholders have reason to be quite optimistic about the future direction of the share price.
Keen to find out how analysts think Yanlord Land Group's future stacks up against the industry? In that case, our free report is a great place to start.Do Revenue Forecasts Match The Low P/S Ratio?
In order to justify its P/S ratio, Yanlord Land Group would need to produce sluggish growth that's trailing the industry.
If we review the last year of revenue growth, the company posted a terrific increase of 51%. The latest three year period has also seen an excellent 73% overall rise in revenue, aided by its short-term performance. Therefore, it's fair to say the revenue growth recently has been superb for the company.
Turning to the outlook, the next year should bring plunging returns, with revenue decreasing 26% as estimated by the dual analysts watching the company. Meanwhile, the broader industry is forecast to moderate by 1.0%, which indicates the company should perform poorly indeed.
With this information, it's not too hard to see why Yanlord Land Group is trading at a lower P/S in comparison. Nonetheless, with revenue going quickly in reverse, it's not guaranteed that the P/S has found a floor yet. There's potential for the P/S to fall to even lower levels if the company doesn't improve its top-line growth.
The Key Takeaway
Yanlord Land Group's stock price has surged recently, but its but its P/S still remains modest. While the price-to-sales ratio shouldn't be the defining factor in whether you buy a stock or not, it's quite a capable barometer of revenue expectations.
We've established that Yanlord Land Group's P/S is about what we expect, seeing as the P/S and revenue growth forecasts are lower than that of an already struggling industry. Right now shareholders are accepting the low P/S as they concede future revenue probably won't provide any pleasant surprises. However, we're still cautious about the company's ability to resist even greater pain to its business from the broader industry turmoil. In the meantime, unless the company's prospects improve they will continue to form a barrier for the share price around these levels.
Many other vital risk factors can be found on the company's balance sheet. Take a look at our free balance sheet analysis for Yanlord Land Group with six simple checks on some of these key factors.
If strong companies turning a profit tickle your fancy, then you'll want to check out this free list of interesting companies that trade on a low P/E (but have proven they can grow earnings).
If you're looking to trade Yanlord Land Group, open an account with the lowest-cost platform trusted by professionals, Interactive Brokers.
With clients in over 200 countries and territories, and access to 160 markets, IBKR lets you trade stocks, options, futures, forex, bonds and funds from a single integrated account.
Enjoy no hidden fees, no account minimums, and FX conversion rates as low as 0.03%, far better than what most brokers offer.
Sponsored ContentNew: Manage All Your Stock Portfolios in One Place
We've created the ultimate portfolio companion for stock investors, and it's free.
• Connect an unlimited number of Portfolios and see your total in one currency
• Be alerted to new Warning Signs or Risks via email or mobile
• Track the Fair Value of your stocks
Have feedback on this article? Concerned about the content? Get in touch with us directly. Alternatively, email editorial-team (at) simplywallst.com.
This article by Simply Wall St is general in nature. We provide commentary based on historical data and analyst forecasts only using an unbiased methodology and our articles are not intended to be financial advice. It does not constitute a recommendation to buy or sell any stock, and does not take account of your objectives, or your financial situation. We aim to bring you long-term focused analysis driven by fundamental data. Note that our analysis may not factor in the latest price-sensitive company announcements or qualitative material. Simply Wall St has no position in any stocks mentioned.
About SGX:Z25
Yanlord Land Group
An investment holding company, operates as a real estate developer in the People's Republic of China, Singapore, and Hong Kong.
Undervalued with adequate balance sheet.

