
Advertisement
- Singapore
- /
- Real Estate
- /
- SGX:9CI
Is There An Opportunity With CapitaLand Investment Limited's (SGX:9CI) 23% Undervaluation?
Key Insights
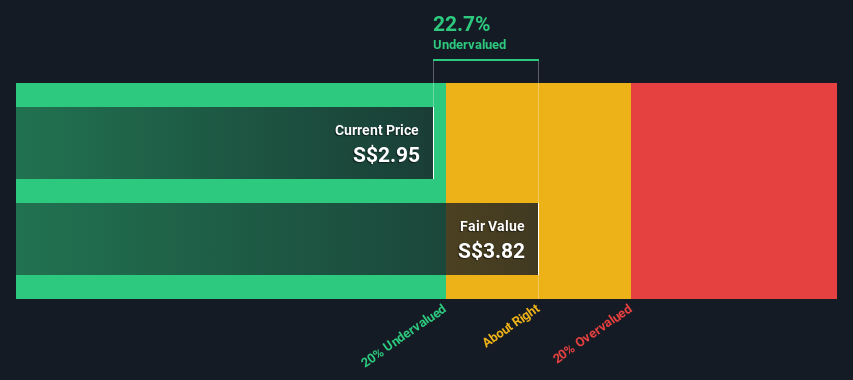
- Using the 2 Stage Free Cash Flow to Equity, CapitaLand Investment fair value estimate is S$3.82
- CapitaLand Investment's S$2.95 share price signals that it might be 23% undervalued
- Our fair value estimate is 2.9% lower than CapitaLand Investment's analyst price target of S$3.93
How far off is CapitaLand Investment Limited (SGX:9CI) from its intrinsic value? Using the most recent financial data, we'll take a look at whether the stock is fairly priced by taking the expected future cash flows and discounting them to their present value. We will take advantage of the Discounted Cash Flow (DCF) model for this purpose. Models like these may appear beyond the comprehension of a lay person, but they're fairly easy to follow.
We generally believe that a company's value is the present value of all of the cash it will generate in the future. However, a DCF is just one valuation metric among many, and it is not without flaws. Anyone interested in learning a bit more about intrinsic value should have a read of the Simply Wall St analysis model.
See our latest analysis for CapitaLand Investment
Crunching The Numbers
We are going to use a two-stage DCF model, which, as the name states, takes into account two stages of growth. The first stage is generally a higher growth period which levels off heading towards the terminal value, captured in the second 'steady growth' period. To start off with, we need to estimate the next ten years of cash flows. Where possible we use analyst estimates, but when these aren't available we extrapolate the previous free cash flow (FCF) from the last estimate or reported value. We assume companies with shrinking free cash flow will slow their rate of shrinkage, and that companies with growing free cash flow will see their growth rate slow, over this period. We do this to reflect that growth tends to slow more in the early years than it does in later years.
Generally we assume that a dollar today is more valuable than a dollar in the future, so we discount the value of these future cash flows to their estimated value in today's dollars:
10-year free cash flow (FCF) forecast
| 2024 | 2025 | 2026 | 2027 | 2028 | 2029 | 2030 | 2031 | 2032 | 2033 | |
| Levered FCF (SGD, Millions) | S$1.39b | S$1.48b | S$1.55b | S$1.61b | S$1.66b | S$1.71b | S$1.75b | S$1.80b | S$1.84b | S$1.88b |
| Growth Rate Estimate Source | Analyst x1 | Analyst x1 | Est @ 4.64% | Est @ 3.86% | Est @ 3.31% | Est @ 2.92% | Est @ 2.65% | Est @ 2.46% | Est @ 2.33% | Est @ 2.24% |
| Present Value (SGD, Millions) Discounted @ 10.0% | S$1.3k | S$1.2k | S$1.2k | S$1.1k | S$1.0k | S$967 | S$903 | S$841 | S$783 | S$728 |
("Est" = FCF growth rate estimated by Simply Wall St)
Present Value of 10-year Cash Flow (PVCF) = S$10b
We now need to calculate the Terminal Value, which accounts for all the future cash flows after this ten year period. The Gordon Growth formula is used to calculate Terminal Value at a future annual growth rate equal to the 5-year average of the 10-year government bond yield of 2.0%. We discount the terminal cash flows to today's value at a cost of equity of 10.0%.
Terminal Value (TV)= FCF2033 × (1 + g) ÷ (r – g) = S$1.9b× (1 + 2.0%) ÷ (10.0%– 2.0%) = S$24b
Present Value of Terminal Value (PVTV)= TV / (1 + r)10= S$24b÷ ( 1 + 10.0%)10= S$9.3b
The total value is the sum of cash flows for the next ten years plus the discounted terminal value, which results in the Total Equity Value, which in this case is S$19b. To get the intrinsic value per share, we divide this by the total number of shares outstanding. Compared to the current share price of S$3.0, the company appears a touch undervalued at a 23% discount to where the stock price trades currently. The assumptions in any calculation have a big impact on the valuation, so it is better to view this as a rough estimate, not precise down to the last cent.
Important Assumptions
The calculation above is very dependent on two assumptions. The first is the discount rate and the other is the cash flows. Part of investing is coming up with your own evaluation of a company's future performance, so try the calculation yourself and check your own assumptions. The DCF also does not consider the possible cyclicality of an industry, or a company's future capital requirements, so it does not give a full picture of a company's potential performance. Given that we are looking at CapitaLand Investment as potential shareholders, the cost of equity is used as the discount rate, rather than the cost of capital (or weighted average cost of capital, WACC) which accounts for debt. In this calculation we've used 10.0%, which is based on a levered beta of 1.589. Beta is a measure of a stock's volatility, compared to the market as a whole. We get our beta from the industry average beta of globally comparable companies, with an imposed limit between 0.8 and 2.0, which is a reasonable range for a stable business.
SWOT Analysis for CapitaLand Investment
Strength
- Dividends are covered by earnings and cash flows.
Weakness
- Earnings declined over the past year.
- Interest payments on debt are not well covered.
- Dividend is low compared to the top 25% of dividend payers in the Real Estate market.
Opportunity
- Annual earnings are forecast to grow faster than the Singaporean market.
- Trading below our estimate of fair value by more than 20%.
Threat
- Debt is not well covered by operating cash flow.
- Annual revenue is forecast to grow slower than the Singaporean market.
Moving On:
Whilst important, the DCF calculation is only one of many factors that you need to assess for a company. The DCF model is not a perfect stock valuation tool. Instead the best use for a DCF model is to test certain assumptions and theories to see if they would lead to the company being undervalued or overvalued. If a company grows at a different rate, or if its cost of equity or risk free rate changes sharply, the output can look very different. Why is the intrinsic value higher than the current share price? For CapitaLand Investment, there are three relevant factors you should look at:
- Risks: To that end, you should learn about the 4 warning signs we've spotted with CapitaLand Investment (including 1 which can't be ignored) .
- Future Earnings: How does 9CI's growth rate compare to its peers and the wider market? Dig deeper into the analyst consensus number for the upcoming years by interacting with our free analyst growth expectation chart.
- Other High Quality Alternatives: Do you like a good all-rounder? Explore our interactive list of high quality stocks to get an idea of what else is out there you may be missing!
PS. Simply Wall St updates its DCF calculation for every Singaporean stock every day, so if you want to find the intrinsic value of any other stock just search here.
New: AI Stock Screener & Alerts
Our new AI Stock Screener scans the market every day to uncover opportunities.
• Dividend Powerhouses (3%+ Yield)
• Undervalued Small Caps with Insider Buying
• High growth Tech and AI Companies
Or build your own from over 50 metrics.
Have feedback on this article? Concerned about the content? Get in touch with us directly. Alternatively, email editorial-team (at) simplywallst.com.
This article by Simply Wall St is general in nature. We provide commentary based on historical data and analyst forecasts only using an unbiased methodology and our articles are not intended to be financial advice. It does not constitute a recommendation to buy or sell any stock, and does not take account of your objectives, or your financial situation. We aim to bring you long-term focused analysis driven by fundamental data. Note that our analysis may not factor in the latest price-sensitive company announcements or qualitative material. Simply Wall St has no position in any stocks mentioned.
About SGX:9CI
CapitaLand Investment
Headquartered and listed in Singapore in 2021, CapitaLand Investment Limited (CLI) is a leading global real asset manager with a strong Asia foothold.
Proven track record with low risk.
Market Insights

Advertisement
Community Narratives
Finding The True Value Of A Logistics Powerhouse
Fair Value US$95.21|8.7% undervalued
NV
Community Contributor
Paradigm Biopharmaceuticals Will Lead Osteoarthritis Treatment with Zilosul's FDA Success
Fair Value AU$5.50|93.3% undervalued
AM
Community Contributor
Barrick Mining (ABX:CA): A Gold Hedge against a U.S. Shutdown
Fair Value CA$60.00|18.7% undervalued
GM
Community Contributor