
Advertisement
These 4 Measures Indicate That Oceanus Group (SGX:579) Is Using Debt Extensively
The external fund manager backed by Berkshire Hathaway's Charlie Munger, Li Lu, makes no bones about it when he says 'The biggest investment risk is not the volatility of prices, but whether you will suffer a permanent loss of capital.' So it seems the smart money knows that debt - which is usually involved in bankruptcies - is a very important factor, when you assess how risky a company is. We can see that Oceanus Group Limited (SGX:579) does use debt in its business. But the real question is whether this debt is making the company risky.
Why Does Debt Bring Risk?
Debt is a tool to help businesses grow, but if a business is incapable of paying off its lenders, then it exists at their mercy. Part and parcel of capitalism is the process of 'creative destruction' where failed businesses are mercilessly liquidated by their bankers. However, a more usual (but still expensive) situation is where a company must dilute shareholders at a cheap share price simply to get debt under control. Of course, plenty of companies use debt to fund growth, without any negative consequences. The first thing to do when considering how much debt a business uses is to look at its cash and debt together.
View our latest analysis for Oceanus Group
What Is Oceanus Group's Net Debt?
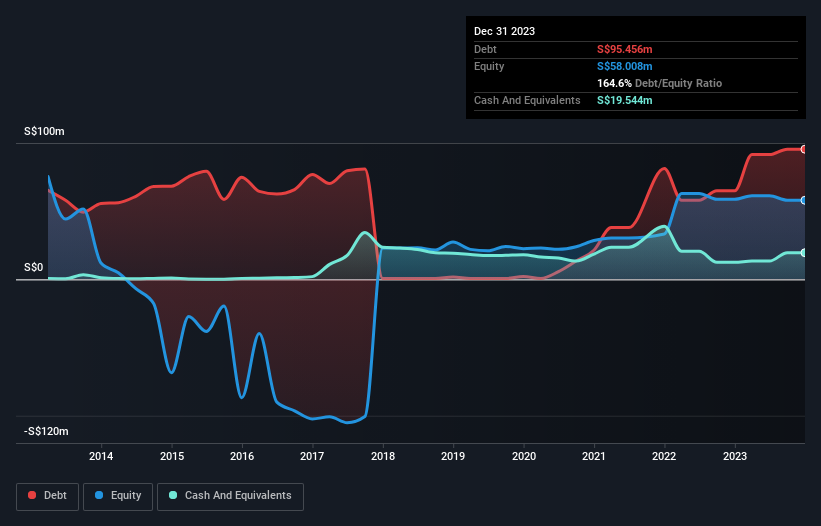
As you can see below, at the end of December 2023, Oceanus Group had S$95.5m of debt, up from S$65.0m a year ago. Click the image for more detail. However, because it has a cash reserve of S$19.5m, its net debt is less, at about S$75.9m.
How Healthy Is Oceanus Group's Balance Sheet?
We can see from the most recent balance sheet that Oceanus Group had liabilities of S$91.5m falling due within a year, and liabilities of S$37.3m due beyond that. Offsetting these obligations, it had cash of S$19.5m as well as receivables valued at S$106.3m due within 12 months. So its liabilities total S$3.04m more than the combination of its cash and short-term receivables.
This state of affairs indicates that Oceanus Group's balance sheet looks quite solid, as its total liabilities are just about equal to its liquid assets. So while it's hard to imagine that the S$205.3m company is struggling for cash, we still think it's worth monitoring its balance sheet.
We use two main ratios to inform us about debt levels relative to earnings. The first is net debt divided by earnings before interest, tax, depreciation, and amortization (EBITDA), while the second is how many times its earnings before interest and tax (EBIT) covers its interest expense (or its interest cover, for short). Thus we consider debt relative to earnings both with and without depreciation and amortization expenses.
Oceanus Group shareholders face the double whammy of a high net debt to EBITDA ratio (9.0), and fairly weak interest coverage, since EBIT is just 0.67 times the interest expense. The debt burden here is substantial. The good news is that Oceanus Group grew its EBIT a smooth 79% over the last twelve months. Like the milk of human kindness that sort of growth increases resilience, making the company more capable of managing debt. There's no doubt that we learn most about debt from the balance sheet. But it is Oceanus Group's earnings that will influence how the balance sheet holds up in the future. So if you're keen to discover more about its earnings, it might be worth checking out this graph of its long term earnings trend.
Finally, while the tax-man may adore accounting profits, lenders only accept cold hard cash. So we always check how much of that EBIT is translated into free cash flow. During the last three years, Oceanus Group burned a lot of cash. While investors are no doubt expecting a reversal of that situation in due course, it clearly does mean its use of debt is more risky.
Our View
Neither Oceanus Group's ability to convert EBIT to free cash flow nor its interest cover gave us confidence in its ability to take on more debt. But its EBIT growth rate tells a very different story, and suggests some resilience. We think that Oceanus Group's debt does make it a bit risky, after considering the aforementioned data points together. That's not necessarily a bad thing, since leverage can boost returns on equity, but it is something to be aware of. The balance sheet is clearly the area to focus on when you are analysing debt. However, not all investment risk resides within the balance sheet - far from it. For example - Oceanus Group has 3 warning signs we think you should be aware of.
At the end of the day, it's often better to focus on companies that are free from net debt. You can access our special list of such companies (all with a track record of profit growth). It's free.
New: AI Stock Screener & Alerts
Our new AI Stock Screener scans the market every day to uncover opportunities.
• Dividend Powerhouses (3%+ Yield)
• Undervalued Small Caps with Insider Buying
• High growth Tech and AI Companies
Or build your own from over 50 metrics.
Have feedback on this article? Concerned about the content? Get in touch with us directly. Alternatively, email editorial-team (at) simplywallst.com.
This article by Simply Wall St is general in nature. We provide commentary based on historical data and analyst forecasts only using an unbiased methodology and our articles are not intended to be financial advice. It does not constitute a recommendation to buy or sell any stock, and does not take account of your objectives, or your financial situation. We aim to bring you long-term focused analysis driven by fundamental data. Note that our analysis may not factor in the latest price-sensitive company announcements or qualitative material. Simply Wall St has no position in any stocks mentioned.
About SGX:579
Oceanus Group
An investment holding company, sells processed marine products, sugar, beverages, and other commodities in the People’s Republic of China, Hong Kong, Macau, Singapore, and Thailand.
Slight risk with questionable track record.
Market Insights

Advertisement
Community Narratives
MicroVision will explode future revenue by 380.37% with a vision towards success
Fair Value US$60|98.4% undervalued
TH
Community Contributor
The Indispensable Artery for a New North American Economy
Fair Value CA$132.87|0.8% undervalued
TI
Community Contributor
Recently Updated Narratives
AL

AlexLovell on Rocket Lab ·
Early mover in a fast growing industry. Likely to experience share price volatility as they scale
Fair Value:US$16.25158.0% overvalued
1 followerusers have followed this narrative
0 commentsusers have commented on this narrative
0 likesusers have liked this narrative
MA


MarkoVT on ANYCOLOR ·
Near zero debt, Japan centric focus provides future growth
Fair Value:JP¥7.61k15.3% undervalued
1 followerusers have followed this narrative
0 commentsusers have commented on this narrative
0 likesusers have liked this narrative
CO

composite32 on TAV Havalimanlari Holding ·
TAV Havalimanlari Holding will fly high with 25.68% revenue growth
Fair Value:₺545.1648.6% undervalued
3 followersusers have followed this narrative
0 commentsusers have commented on this narrative
0 likesusers have liked this narrative
Popular Narratives
TH

TheWallstreetKing on MicroVision ·
MicroVision will explode future revenue by 380.37% with a vision towards success
Fair Value:US$6098.4% undervalued
96 followersusers have followed this narrative
10 commentsusers have commented on this narrative
19 likesusers have liked this narrative
OS


oscargarcia on Alphabet ·
The company that turned a verb into a global necessity and basically runs the modern internet, digital ads, smartphones, maps, and AI.
Fair Value:US$3405.9% undervalued
137 followersusers have followed this narrative
6 commentsusers have commented on this narrative
18 likesusers have liked this narrative
AN


AnalystConsensusTarget on NVIDIA ·
NVDA: Expanding AI Demand Will Drive Major Data Center Investments Through 2026
Fair Value:US$232.7922.6% undervalued
929 followersusers have followed this narrative
6 commentsusers have commented on this narrative
22 likesusers have liked this narrative