- Singapore
- /
- Energy Services
- /
- SGX:RXS
Is Pacific Radiance Ltd.'s (SGX:RXS) Stock's Recent Performance Being Led By Its Attractive Financial Prospects?


Pacific Radiance's (SGX:RXS) stock is up by a considerable 16% over the past month. Given that the market rewards strong financials in the long-term, we wonder if that is the case in this instance. Particularly, we will be paying attention to Pacific Radiance's ROE today.
Return on equity or ROE is a key measure used to assess how efficiently a company's management is utilizing the company's capital. Put another way, it reveals the company's success at turning shareholder investments into profits.
See our latest analysis for Pacific Radiance
How Is ROE Calculated?
Return on equity can be calculated by using the formula:
Return on Equity = Net Profit (from continuing operations) ÷ Shareholders' Equity
So, based on the above formula, the ROE for Pacific Radiance is:
38% = US$15m ÷ US$38m (Based on the trailing twelve months to December 2023).
The 'return' is the amount earned after tax over the last twelve months. Another way to think of that is that for every SGD1 worth of equity, the company was able to earn SGD0.38 in profit.
What Has ROE Got To Do With Earnings Growth?
So far, we've learned that ROE is a measure of a company's profitability. Depending on how much of these profits the company reinvests or "retains", and how effectively it does so, we are then able to assess a company’s earnings growth potential. Assuming all else is equal, companies that have both a higher return on equity and higher profit retention are usually the ones that have a higher growth rate when compared to companies that don't have the same features.
Pacific Radiance's Earnings Growth And 38% ROE
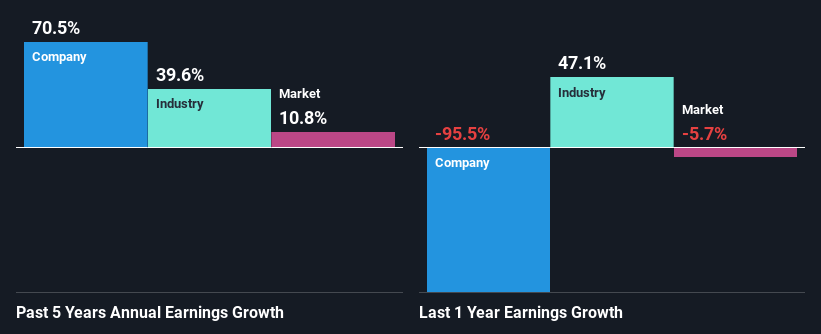
To begin with, Pacific Radiance has a pretty high ROE which is interesting. Secondly, even when compared to the industry average of 8.7% the company's ROE is quite impressive. So, the substantial 71% net income growth seen by Pacific Radiance over the past five years isn't overly surprising.
As a next step, we compared Pacific Radiance's net income growth with the industry, and pleasingly, we found that the growth seen by the company is higher than the average industry growth of 40%.
Earnings growth is an important metric to consider when valuing a stock. The investor should try to establish if the expected growth or decline in earnings, whichever the case may be, is priced in. Doing so will help them establish if the stock's future looks promising or ominous. One good indicator of expected earnings growth is the P/E ratio which determines the price the market is willing to pay for a stock based on its earnings prospects. So, you may want to check if Pacific Radiance is trading on a high P/E or a low P/E, relative to its industry.
Is Pacific Radiance Using Its Retained Earnings Effectively?
Pacific Radiance doesn't pay any regular dividends currently which essentially means that it has been reinvesting all of its profits into the business. This definitely contributes to the high earnings growth number that we discussed above.
Conclusion
Overall, we are quite pleased with Pacific Radiance's performance. Specifically, we like that the company is reinvesting a huge chunk of its profits at a high rate of return. This of course has caused the company to see substantial growth in its earnings. If the company continues to grow its earnings the way it has, that could have a positive impact on its share price given how earnings per share influence long-term share prices. Not to forget, share price outcomes are also dependent on the potential risks a company may face. So it is important for investors to be aware of the risks involved in the business. To know the 5 risks we have identified for Pacific Radiance visit our risks dashboard for free.
New: Manage All Your Stock Portfolios in One Place
We've created the ultimate portfolio companion for stock investors, and it's free.
• Connect an unlimited number of Portfolios and see your total in one currency
• Be alerted to new Warning Signs or Risks via email or mobile
• Track the Fair Value of your stocks
Have feedback on this article? Concerned about the content? Get in touch with us directly. Alternatively, email editorial-team (at) simplywallst.com.
This article by Simply Wall St is general in nature. We provide commentary based on historical data and analyst forecasts only using an unbiased methodology and our articles are not intended to be financial advice. It does not constitute a recommendation to buy or sell any stock, and does not take account of your objectives, or your financial situation. We aim to bring you long-term focused analysis driven by fundamental data. Note that our analysis may not factor in the latest price-sensitive company announcements or qualitative material. Simply Wall St has no position in any stocks mentioned.
Have feedback on this article? Concerned about the content? Get in touch with us directly. Alternatively, email editorial-team@simplywallst.com
About SGX:RXS
Pacific Radiance
An investment holding company, owns, operates, and manages offshore vessels and provides offshore support services.
Flawless balance sheet and undervalued.
Market Insights

Community Narratives
