
Advertisement
- Singapore
- /
- Oil and Gas
- /
- SGX:AUE
Golden Energy and Resources'(SGX:AUE) Share Price Is Down 59% Over The Past Three Years.
If you love investing in stocks you're bound to buy some losers. But the long term shareholders of Golden Energy and Resources Limited (SGX:AUE) have had an unfortunate run in the last three years. So they might be feeling emotional about the 59% share price collapse, in that time. It's up 1.8% in the last seven days.
View our latest analysis for Golden Energy and Resources
To quote Buffett, 'Ships will sail around the world but the Flat Earth Society will flourish. There will continue to be wide discrepancies between price and value in the marketplace...' One way to examine how market sentiment has changed over time is to look at the interaction between a company's share price and its earnings per share (EPS).
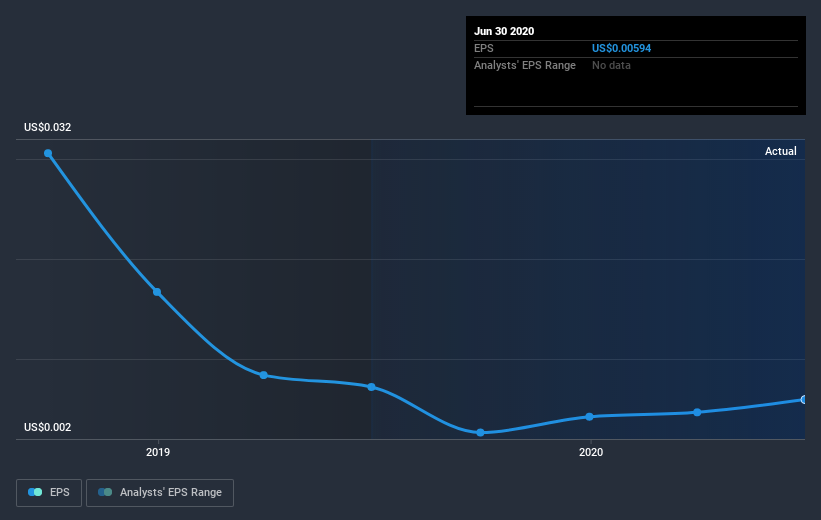
During the three years that the share price fell, Golden Energy and Resources' earnings per share (EPS) dropped by 36% each year. This fall in the EPS is worse than the 26% compound annual share price fall. This suggests that the market retains some optimism around long term earnings stability, despite past EPS declines.
The image below shows how EPS has tracked over time (if you click on the image you can see greater detail).
It might be well worthwhile taking a look at our free report on Golden Energy and Resources' earnings, revenue and cash flow.
What about the Total Shareholder Return (TSR)?
We'd be remiss not to mention the difference between Golden Energy and Resources' total shareholder return (TSR) and its share price return. Arguably the TSR is a more complete return calculation because it accounts for the value of dividends (as if they were reinvested), along with the hypothetical value of any discounted capital that have been offered to shareholders. Golden Energy and Resources' TSR of was a loss of 55% for the 3 years. That wasn't as bad as its share price return, because it has paid dividends.
A Different Perspective
Golden Energy and Resources shareholders are down 7.2% for the year, falling short of the market return. Meanwhile, the broader market slid about 6.1%, likely weighing on the stock. However, the loss over the last year isn't as bad as the 16% per annum loss investors have suffered over the last three years. We'd need clear signs of growth in the underlying business before we could muster much enthusiasm for this one. It's always interesting to track share price performance over the longer term. But to understand Golden Energy and Resources better, we need to consider many other factors. To that end, you should be aware of the 1 warning sign we've spotted with Golden Energy and Resources .
If you like to buy stocks alongside management, then you might just love this free list of companies. (Hint: insiders have been buying them).
Please note, the market returns quoted in this article reflect the market weighted average returns of stocks that currently trade on SG exchanges.
When trading Golden Energy and Resources or any other investment, use the platform considered by many to be the Professional's Gateway to the Worlds Market, Interactive Brokers. You get the lowest-cost* trading on stocks, options, futures, forex, bonds and funds worldwide from a single integrated account. Promoted
New: Manage All Your Stock Portfolios in One Place
We've created the ultimate portfolio companion for stock investors, and it's free.
• Connect an unlimited number of Portfolios and see your total in one currency
• Be alerted to new Warning Signs or Risks via email or mobile
• Track the Fair Value of your stocks
This article by Simply Wall St is general in nature. It does not constitute a recommendation to buy or sell any stock, and does not take account of your objectives, or your financial situation. We aim to bring you long-term focused analysis driven by fundamental data. Note that our analysis may not factor in the latest price-sensitive company announcements or qualitative material. Simply Wall St has no position in any stocks mentioned.
*Interactive Brokers Rated Lowest Cost Broker by StockBrokers.com Annual Online Review 2020
Have feedback on this article? Concerned about the content? Get in touch with us directly. Alternatively, email editorial-team (at) simplywallst.com.
About SGX:AUE
Golden Energy and Resources
Golden Energy and Resources Limited, an investment holding company, engages in the provision of management services, coal mining and trading, and forestry activities.
Outstanding track record with excellent balance sheet.
Similar Companies
Market Insights

Advertisement
Community Narratives
MINISO's fair value is projected at 26.69 with an anticipated PE ratio shift of 20x
Fair Value US$24.03|12.0% undervalued
BE
Community Contributor
Procter & Gamble: A Dividend Giant Facing Slowing Growth
Fair Value US$119.81|21.7% overvalued
AN
Community Contributor
Eli Lilly's Future Growth Driven by Tirzepatide and Favorable Market Conditions
Fair Value US$1.19k|14.1% undervalued
EA
Community Contributor