
What are the early trends we should look for to identify a stock that could multiply in value over the long term? In a perfect world, we'd like to see a company investing more capital into its business and ideally the returns earned from that capital are also increasing. Basically this means that a company has profitable initiatives that it can continue to reinvest in, which is a trait of a compounding machine. So on that note, Interra Resources (SGX:5GI) looks quite promising in regards to its trends of return on capital.
Understanding Return On Capital Employed (ROCE)
For those that aren't sure what ROCE is, it measures the amount of pre-tax profits a company can generate from the capital employed in its business. To calculate this metric for Interra Resources, this is the formula:
Return on Capital Employed = Earnings Before Interest and Tax (EBIT) ÷ (Total Assets - Current Liabilities)
0.19 = US$7.8m ÷ (US$51m - US$11m) (Based on the trailing twelve months to June 2022).
So, Interra Resources has an ROCE of 19%. In isolation, that's a pretty standard return but against the Oil and Gas industry average of 27%, it's not as good.
Our analysis indicates that 5GI is potentially undervalued!
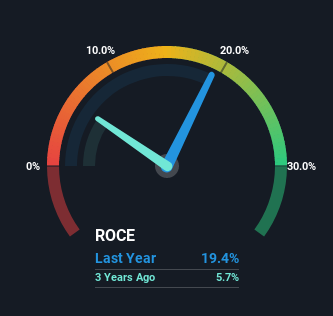
Historical performance is a great place to start when researching a stock so above you can see the gauge for Interra Resources' ROCE against it's prior returns. If you want to delve into the historical earnings, revenue and cash flow of Interra Resources, check out these free graphs here.
What Can We Tell From Interra Resources' ROCE Trend?
The fact that Interra Resources is now generating some pre-tax profits from its prior investments is very encouraging. Shareholders would no doubt be pleased with this because the business was loss-making five years ago but is is now generating 19% on its capital. And unsurprisingly, like most companies trying to break into the black, Interra Resources is utilizing 41% more capital than it was five years ago. This can tell us that the company has plenty of reinvestment opportunities that are able to generate higher returns.
In another part of our analysis, we noticed that the company's ratio of current liabilities to total assets decreased to 21%, which broadly means the business is relying less on its suppliers or short-term creditors to fund its operations. So this improvement in ROCE has come from the business' underlying economics, which is great to see.
In Conclusion...
Long story short, we're delighted to see that Interra Resources' reinvestment activities have paid off and the company is now profitable. Given the stock has declined 54% in the last five years, this could be a good investment if the valuation and other metrics are also appealing. So researching this company further and determining whether or not these trends will continue seems justified.
One more thing, we've spotted 2 warning signs facing Interra Resources that you might find interesting.
If you want to search for solid companies with great earnings, check out this free list of companies with good balance sheets and impressive returns on equity.
Mobile Infrastructure for Defense and Disaster
The next wave in robotics isn't humanoid. Its fully autonomous towers delivering 5G, ISR, and radar in under 30 minutes, anywhere.
Get the investor briefing before the next round of contracts
Sponsored On Behalf of CiTechNew: AI Stock Screener & Alerts
Our new AI Stock Screener scans the market every day to uncover opportunities.
• Dividend Powerhouses (3%+ Yield)
• Undervalued Small Caps with Insider Buying
• High growth Tech and AI Companies
Or build your own from over 50 metrics.
Have feedback on this article? Concerned about the content? Get in touch with us directly. Alternatively, email editorial-team (at) simplywallst.com.
This article by Simply Wall St is general in nature. We provide commentary based on historical data and analyst forecasts only using an unbiased methodology and our articles are not intended to be financial advice. It does not constitute a recommendation to buy or sell any stock, and does not take account of your objectives, or your financial situation. We aim to bring you long-term focused analysis driven by fundamental data. Note that our analysis may not factor in the latest price-sensitive company announcements or qualitative material. Simply Wall St has no position in any stocks mentioned.
About SGX:5GI
Interra Resources
An investment holding company, engages in the exploration and operation of oil fields for crude petroleum production in Indonesia and Myanmar.
Flawless balance sheet with solid track record.
Market Insights

Weekly Picks

Early mover in a fast growing industry. Likely to experience share price volatility as they scale


A case for CA$31.80 (undiluted), aka 8,616% upside from CA$0.37 (an 86 bagger!).


Moderation and Stabilisation: HOLD: Fair Price based on a 4-year Cycle is $12.08
Recently Updated Narratives


Positioned to Win as the Streaming Wars Settle

Meta’s Bold Bet on AI Pays Off

ADP Stock: Solid Fundamentals, But AI Investments Test Its Margin Resilience
Popular Narratives


Crazy Undervalued 42 Baggers Silver Play (Active & Running Mine)


NVDA: Expanding AI Demand Will Drive Major Data Center Investments Through 2026

The AI Infrastructure Giant Grows Into Its Valuation
Trending Discussion

