- Singapore
- /
- Hospitality
- /
- SGX:G13
Genting Singapore (SGX:G13) Share Prices Have Dropped 39% In The Last Three Years


Genting Singapore Limited (SGX:G13) shareholders should be happy to see the share price up 29% in the last month. But that doesn't change the fact that the returns over the last three years have been less than pleasing. After all, the share price is down 39% in the last three years, significantly under-performing the market.
View our latest analysis for Genting Singapore
There is no denying that markets are sometimes efficient, but prices do not always reflect underlying business performance. One imperfect but simple way to consider how the market perception of a company has shifted is to compare the change in the earnings per share (EPS) with the share price movement.
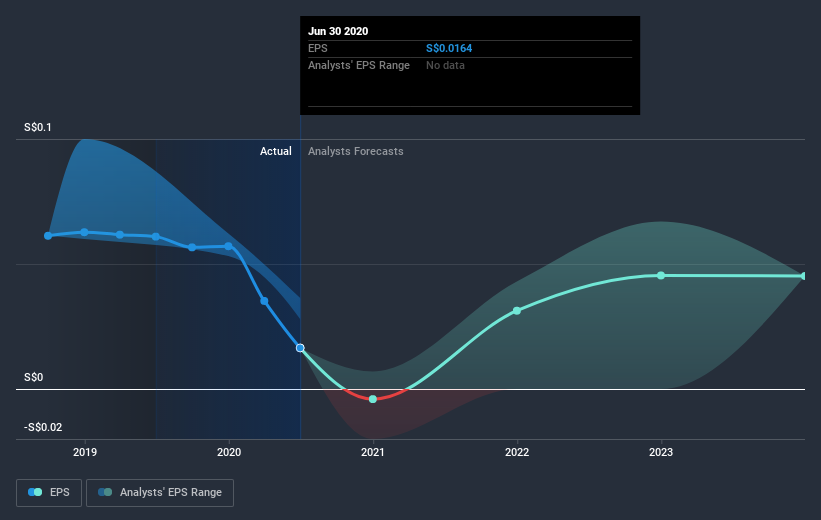
During the three years that the share price fell, Genting Singapore's earnings per share (EPS) dropped by 31% each year. In comparison the 15% compound annual share price decline isn't as bad as the EPS drop-off. This suggests that the market retains some optimism around long term earnings stability, despite past EPS declines. This positive sentiment is also reflected in the generous P/E ratio of 50.55.
You can see how EPS has changed over time in the image below (click on the chart to see the exact values).
Before buying or selling a stock, we always recommend a close examination of historic growth trends, available here.
What about the Total Shareholder Return (TSR)?
We've already covered Genting Singapore's share price action, but we should also mention its total shareholder return (TSR). The TSR is a return calculation that accounts for the value of cash dividends (assuming that any dividend received was reinvested) and the calculated value of any discounted capital raisings and spin-offs. Its history of dividend payouts mean that Genting Singapore's TSR, which was a 32% drop over the last 3 years, was not as bad as the share price return.
A Different Perspective
Although it hurts that Genting Singapore returned a loss of 8.0% in the last twelve months, the broader market was actually worse, returning a loss of 10%. Of course, the long term returns are far more important and the good news is that over five years, the stock has returned 4% for each year. It could be that the business is just facing some short term problems, but shareholders should keep a close eye on the fundamentals. It's always interesting to track share price performance over the longer term. But to understand Genting Singapore better, we need to consider many other factors. Case in point: We've spotted 1 warning sign for Genting Singapore you should be aware of.
Of course, you might find a fantastic investment by looking elsewhere. So take a peek at this free list of companies we expect will grow earnings.
Please note, the market returns quoted in this article reflect the market weighted average returns of stocks that currently trade on SG exchanges.
If you decide to trade Genting Singapore, use the lowest-cost* platform that is rated #1 Overall by Barron’s, Interactive Brokers. Trade stocks, options, futures, forex, bonds and funds on 135 markets, all from a single integrated account. Promoted
If you're looking to trade Genting Singapore, open an account with the lowest-cost platform trusted by professionals, Interactive Brokers.
With clients in over 200 countries and territories, and access to 160 markets, IBKR lets you trade stocks, options, futures, forex, bonds and funds from a single integrated account.
Enjoy no hidden fees, no account minimums, and FX conversion rates as low as 0.03%, far better than what most brokers offer.
Sponsored ContentNew: Manage All Your Stock Portfolios in One Place
We've created the ultimate portfolio companion for stock investors, and it's free.
• Connect an unlimited number of Portfolios and see your total in one currency
• Be alerted to new Warning Signs or Risks via email or mobile
• Track the Fair Value of your stocks
This article by Simply Wall St is general in nature. It does not constitute a recommendation to buy or sell any stock, and does not take account of your objectives, or your financial situation. We aim to bring you long-term focused analysis driven by fundamental data. Note that our analysis may not factor in the latest price-sensitive company announcements or qualitative material. Simply Wall St has no position in any stocks mentioned.
*Interactive Brokers Rated Lowest Cost Broker by StockBrokers.com Annual Online Review 2020
Have feedback on this article? Concerned about the content? Get in touch with us directly. Alternatively, email editorial-team@simplywallst.com.
About SGX:G13
Genting Singapore
An investment holding company, primarily engages in the construction, development, and operation of integrated resort destinations in Asia.
Flawless balance sheet and good value.

