
Advertisement
- Singapore
- /
- Hospitality
- /
- SGX:596
A Piece Of The Puzzle Missing From Pavillon Holdings Ltd.'s (SGX:596) 40% Share Price Climb
Despite an already strong run, Pavillon Holdings Ltd. (SGX:596) shares have been powering on, with a gain of 40% in the last thirty days. While recent buyers may be laughing, long-term holders might not be as pleased since the recent gain only brings the stock back to where it started a year ago.
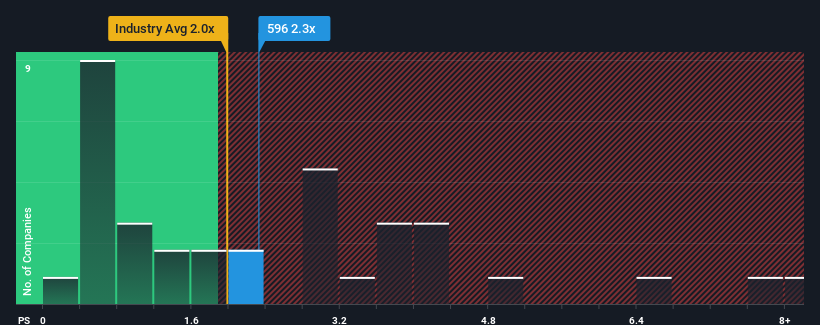
In spite of the firm bounce in price, you could still be forgiven for feeling indifferent about Pavillon Holdings' P/S ratio of 2.3x, since the median price-to-sales (or "P/S") ratio for the Hospitality industry in Singapore is also close to 2x. While this might not raise any eyebrows, if the P/S ratio is not justified investors could be missing out on a potential opportunity or ignoring looming disappointment.
Check out our latest analysis for Pavillon Holdings
What Does Pavillon Holdings' Recent Performance Look Like?
For instance, Pavillon Holdings' receding revenue in recent times would have to be some food for thought. One possibility is that the P/S is moderate because investors think the company might still do enough to be in line with the broader industry in the near future. If you like the company, you'd at least be hoping this is the case so that you could potentially pick up some stock while it's not quite in favour.
Although there are no analyst estimates available for Pavillon Holdings, take a look at this free data-rich visualisation to see how the company stacks up on earnings, revenue and cash flow.Do Revenue Forecasts Match The P/S Ratio?
The only time you'd be comfortable seeing a P/S like Pavillon Holdings' is when the company's growth is tracking the industry closely.
Taking a look back first, the company's revenue growth last year wasn't something to get excited about as it posted a disappointing decline of 2.0%. Still, the latest three year period has seen an excellent 77% overall rise in revenue, in spite of its unsatisfying short-term performance. Although it's been a bumpy ride, it's still fair to say the revenue growth recently has been more than adequate for the company.
Comparing that recent medium-term revenue trajectory with the industry's one-year growth forecast of 18% shows it's noticeably more attractive.
With this information, we find it interesting that Pavillon Holdings is trading at a fairly similar P/S compared to the industry. Apparently some shareholders believe the recent performance is at its limits and have been accepting lower selling prices.
What Does Pavillon Holdings' P/S Mean For Investors?
Its shares have lifted substantially and now Pavillon Holdings' P/S is back within range of the industry median. It's argued the price-to-sales ratio is an inferior measure of value within certain industries, but it can be a powerful business sentiment indicator.
We've established that Pavillon Holdings currently trades on a lower than expected P/S since its recent three-year growth is higher than the wider industry forecast. It'd be fair to assume that potential risks the company faces could be the contributing factor to the lower than expected P/S. While recent revenue trends over the past medium-term suggest that the risk of a price decline is low, investors appear to see the likelihood of revenue fluctuations in the future.
There are also other vital risk factors to consider before investing and we've discovered 1 warning sign for Pavillon Holdings that you should be aware of.
If companies with solid past earnings growth is up your alley, you may wish to see this free collection of other companies with strong earnings growth and low P/E ratios.
New: Manage All Your Stock Portfolios in One Place
We've created the ultimate portfolio companion for stock investors, and it's free.
• Connect an unlimited number of Portfolios and see your total in one currency
• Be alerted to new Warning Signs or Risks via email or mobile
• Track the Fair Value of your stocks
Have feedback on this article? Concerned about the content? Get in touch with us directly. Alternatively, email editorial-team (at) simplywallst.com.
This article by Simply Wall St is general in nature. We provide commentary based on historical data and analyst forecasts only using an unbiased methodology and our articles are not intended to be financial advice. It does not constitute a recommendation to buy or sell any stock, and does not take account of your objectives, or your financial situation. We aim to bring you long-term focused analysis driven by fundamental data. Note that our analysis may not factor in the latest price-sensitive company announcements or qualitative material. Simply Wall St has no position in any stocks mentioned.
About SGX:596
Pavillon Holdings
An investment holding company, operates and franchises restaurants in Singapore, the People's Republic of China, and Vietnam.
Adequate balance sheet with very low risk.
Market Insights

Advertisement
Community Narratives
A formidable player in AI and enterprise computing.
Fair Value US$210.00|12.2% overvalued
CO
Community Contributor
IREN's Bold Moves in Sustainable Bitcoin Mining & AI Data Centers
Fair Value US$72.52|17.1% undervalued
BL
Community Contributor
Cooling the Champions: The Aussie Tech Behind F1's Victories
Fair Value AU$12.40|38.7% undervalued
TR
Community Contributor