
Advertisement
- Singapore
- /
- Construction
- /
- SGX:MF6
Subdued Growth No Barrier To Mun Siong Engineering Limited (SGX:MF6) With Shares Advancing 48%
Mun Siong Engineering Limited (SGX:MF6) shares have had a really impressive month, gaining 48% after a shaky period beforehand. Unfortunately, the gains of the last month did little to right the losses of the last year with the stock still down 13% over that time.
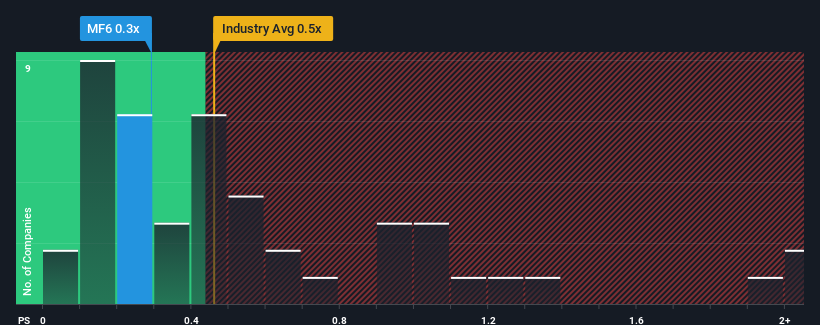
Although its price has surged higher, there still wouldn't be many who think Mun Siong Engineering's price-to-sales (or "P/S") ratio of 0.3x is worth a mention when the median P/S in Singapore's Construction industry is similar at about 0.5x. While this might not raise any eyebrows, if the P/S ratio is not justified investors could be missing out on a potential opportunity or ignoring looming disappointment.
See our latest analysis for Mun Siong Engineering
What Does Mun Siong Engineering's P/S Mean For Shareholders?
Mun Siong Engineering has been doing a decent job lately as it's been growing revenue at a reasonable pace. It might be that many expect the respectable revenue performance to only match most other companies over the coming period, which has kept the P/S from rising. If not, then at least existing shareholders probably aren't too pessimistic about the future direction of the share price.
We don't have analyst forecasts, but you can see how recent trends are setting up the company for the future by checking out our free report on Mun Siong Engineering's earnings, revenue and cash flow.Is There Some Revenue Growth Forecasted For Mun Siong Engineering?
Mun Siong Engineering's P/S ratio would be typical for a company that's only expected to deliver moderate growth, and importantly, perform in line with the industry.
Retrospectively, the last year delivered a decent 2.5% gain to the company's revenues. The solid recent performance means it was also able to grow revenue by 23% in total over the last three years. So we can start by confirming that the company has actually done a good job of growing revenue over that time.
Comparing that to the industry, which is predicted to deliver 13% growth in the next 12 months, the company's momentum is weaker, based on recent medium-term annualised revenue results.
In light of this, it's curious that Mun Siong Engineering's P/S sits in line with the majority of other companies. Apparently many investors in the company are less bearish than recent times would indicate and aren't willing to let go of their stock right now. They may be setting themselves up for future disappointment if the P/S falls to levels more in line with recent growth rates.
The Bottom Line On Mun Siong Engineering's P/S
Mun Siong Engineering appears to be back in favour with a solid price jump bringing its P/S back in line with other companies in the industry Typically, we'd caution against reading too much into price-to-sales ratios when settling on investment decisions, though it can reveal plenty about what other market participants think about the company.
We've established that Mun Siong Engineering's average P/S is a bit surprising since its recent three-year growth is lower than the wider industry forecast. When we see weak revenue with slower than industry growth, we suspect the share price is at risk of declining, bringing the P/S back in line with expectations. If recent medium-term revenue trends continue, the probability of a share price decline will become quite substantial, placing shareholders at risk.
And what about other risks? Every company has them, and we've spotted 3 warning signs for Mun Siong Engineering (of which 2 make us uncomfortable!) you should know about.
If you're unsure about the strength of Mun Siong Engineering's business, why not explore our interactive list of stocks with solid business fundamentals for some other companies you may have missed.
New: Manage All Your Stock Portfolios in One Place
We've created the ultimate portfolio companion for stock investors, and it's free.
• Connect an unlimited number of Portfolios and see your total in one currency
• Be alerted to new Warning Signs or Risks via email or mobile
• Track the Fair Value of your stocks
Have feedback on this article? Concerned about the content? Get in touch with us directly. Alternatively, email editorial-team (at) simplywallst.com.
This article by Simply Wall St is general in nature. We provide commentary based on historical data and analyst forecasts only using an unbiased methodology and our articles are not intended to be financial advice. It does not constitute a recommendation to buy or sell any stock, and does not take account of your objectives, or your financial situation. We aim to bring you long-term focused analysis driven by fundamental data. Note that our analysis may not factor in the latest price-sensitive company announcements or qualitative material. Simply Wall St has no position in any stocks mentioned.
About SGX:MF6
Mun Siong Engineering
Provides mechanical and electrical engineering services for the oil and gas, process, petrochemical, energy, chemical, power, and pharmaceutical industries worldwide.
Mediocre balance sheet with low risk.
Market Insights

Advertisement
Weekly Picks
RO


RockeTeller on Santacruz Silver Mining ·
Crazy Undervalued 42 Baggers Silver Play (Active & Running Mine)
Fair Value:CA$8696.7% undervalued
16 followersusers have followed this narrative
5 commentsusers have commented on this narrative
3 likesusers have liked this narrative
RO


Robbo on Fiducian Group ·
Fiducian: Compliance Clouds or Value Opportunity?
Fair Value:AU$126.1% undervalued
3 followersusers have followed this narrative
0 commentsusers have commented on this narrative
0 likesusers have liked this narrative
WO

woodworthfund on Willamette Valley Vineyards ·
Willamette Valley Vineyards (WVVI): Not-So-Great Value
Fair Value:US$242.5% overvalued
2 followersusers have followed this narrative
0 commentsusers have commented on this narrative
1 likeusers have liked this narrative
Recently Updated Narratives
MA


MarkoVT on Alphabet ·
Positioned globally, partnered locally
Fair Value:US$390.1919.1% undervalued
1 followerusers have followed this narrative
0 commentsusers have commented on this narrative
0 likesusers have liked this narrative
JO


JohnJ on Worldline ·
When will fraudsters be investigated in depth. Fraud was ongoing in France too.
Fair Value:€0.5200.8% overvalued
1 followerusers have followed this narrative
0 commentsusers have commented on this narrative
0 likesusers have liked this narrative
MA

MarkoVT on Applied Digital ·
Staggered by dilution; positions for growth
Fair Value:US$35.4520.9% undervalued
4 followersusers have followed this narrative
0 commentsusers have commented on this narrative
0 likesusers have liked this narrative
Popular Narratives
TH


TheWallstreetKing on MicroVision ·
MicroVision will explode future revenue by 380.37% with a vision towards success
Fair Value:US$6098.6% undervalued
112 followersusers have followed this narrative
11 commentsusers have commented on this narrative
22 likesusers have liked this narrative
AN


AnalystConsensusTarget on NVIDIA ·
NVDA: Expanding AI Demand Will Drive Major Data Center Investments Through 2026
Fair Value:US$250.3927.5% undervalued
948 followersusers have followed this narrative
6 commentsusers have commented on this narrative
24 likesusers have liked this narrative
OS

oscargarcia on Alphabet ·
The company that turned a verb into a global necessity and basically runs the modern internet, digital ads, smartphones, maps, and AI.
Fair Value:US$3407.1% undervalued
148 followersusers have followed this narrative
6 commentsusers have commented on this narrative
18 likesusers have liked this narrative

