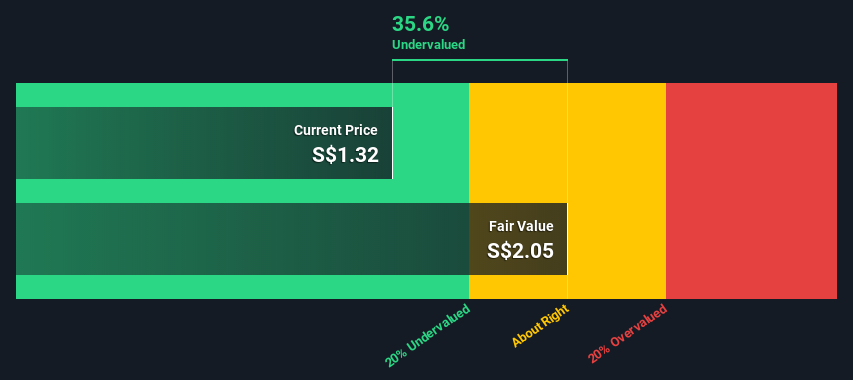
An Intrinsic Calculation For Yangzijiang Shipbuilding (Holdings) Ltd. (SGX:BS6) Suggests It's 36% Undervalued


Does the December share price for Yangzijiang Shipbuilding (Holdings) Ltd. (SGX:BS6) reflect what it's really worth? Today, we will estimate the stock's intrinsic value by taking the expected future cash flows and discounting them to their present value. We will use the Discounted Cash Flow (DCF) model on this occasion. Models like these may appear beyond the comprehension of a lay person, but they're fairly easy to follow.
We would caution that there are many ways of valuing a company and, like the DCF, each technique has advantages and disadvantages in certain scenarios. If you still have some burning questions about this type of valuation, take a look at the Simply Wall St analysis model.
See our latest analysis for Yangzijiang Shipbuilding (Holdings)
What's the estimated valuation?
We use what is known as a 2-stage model, which simply means we have two different periods of growth rates for the company's cash flows. Generally the first stage is higher growth, and the second stage is a lower growth phase. To start off with, we need to estimate the next ten years of cash flows. Where possible we use analyst estimates, but when these aren't available we extrapolate the previous free cash flow (FCF) from the last estimate or reported value. We assume companies with shrinking free cash flow will slow their rate of shrinkage, and that companies with growing free cash flow will see their growth rate slow, over this period. We do this to reflect that growth tends to slow more in the early years than it does in later years.
A DCF is all about the idea that a dollar in the future is less valuable than a dollar today, so we discount the value of these future cash flows to their estimated value in today's dollars:
10-year free cash flow (FCF) estimate
| 2022 | 2023 | 2024 | 2025 | 2026 | 2027 | 2028 | 2029 | 2030 | 2031 | |
| Levered FCF (CN¥, Millions) | CN¥1.03b | CN¥1.91b | CN¥2.05b | CN¥2.17b | CN¥2.28b | CN¥2.36b | CN¥2.44b | CN¥2.51b | CN¥2.57b | CN¥2.63b |
| Growth Rate Estimate Source | Analyst x2 | Analyst x2 | Est @ 7.7% | Est @ 5.94% | Est @ 4.71% | Est @ 3.85% | Est @ 3.25% | Est @ 2.82% | Est @ 2.53% | Est @ 2.32% |
| Present Value (CN¥, Millions) Discounted @ 7.5% | CN¥960 | CN¥1.6k | CN¥1.7k | CN¥1.6k | CN¥1.6k | CN¥1.5k | CN¥1.5k | CN¥1.4k | CN¥1.3k | CN¥1.3k |
("Est" = FCF growth rate estimated by Simply Wall St)
Present Value of 10-year Cash Flow (PVCF) = CN¥15b
After calculating the present value of future cash flows in the initial 10-year period, we need to calculate the Terminal Value, which accounts for all future cash flows beyond the first stage. The Gordon Growth formula is used to calculate Terminal Value at a future annual growth rate equal to the 5-year average of the 10-year government bond yield of 1.8%. We discount the terminal cash flows to today's value at a cost of equity of 7.5%.
Terminal Value (TV)= FCF2031 × (1 + g) ÷ (r – g) = CN¥2.6b× (1 + 1.8%) ÷ (7.5%– 1.8%) = CN¥48b
Present Value of Terminal Value (PVTV)= TV / (1 + r)10= CN¥48b÷ ( 1 + 7.5%)10= CN¥23b
The total value, or equity value, is then the sum of the present value of the future cash flows, which in this case is CN¥38b. The last step is to then divide the equity value by the number of shares outstanding. Relative to the current share price of S$1.3, the company appears quite undervalued at a 36% discount to where the stock price trades currently. The assumptions in any calculation have a big impact on the valuation, so it is better to view this as a rough estimate, not precise down to the last cent.
Important assumptions
The calculation above is very dependent on two assumptions. The first is the discount rate and the other is the cash flows. If you don't agree with these result, have a go at the calculation yourself and play with the assumptions. The DCF also does not consider the possible cyclicality of an industry, or a company's future capital requirements, so it does not give a full picture of a company's potential performance. Given that we are looking at Yangzijiang Shipbuilding (Holdings) as potential shareholders, the cost of equity is used as the discount rate, rather than the cost of capital (or weighted average cost of capital, WACC) which accounts for debt. In this calculation we've used 7.5%, which is based on a levered beta of 1.131. Beta is a measure of a stock's volatility, compared to the market as a whole. We get our beta from the industry average beta of globally comparable companies, with an imposed limit between 0.8 and 2.0, which is a reasonable range for a stable business.
Moving On:
Although the valuation of a company is important, it ideally won't be the sole piece of analysis you scrutinize for a company. The DCF model is not a perfect stock valuation tool. Rather it should be seen as a guide to "what assumptions need to be true for this stock to be under/overvalued?" If a company grows at a different rate, or if its cost of equity or risk free rate changes sharply, the output can look very different. Why is the intrinsic value higher than the current share price? For Yangzijiang Shipbuilding (Holdings), we've compiled three pertinent aspects you should assess:
- Risks: Every company has them, and we've spotted 1 warning sign for Yangzijiang Shipbuilding (Holdings) you should know about.
- Future Earnings: How does BS6's growth rate compare to its peers and the wider market? Dig deeper into the analyst consensus number for the upcoming years by interacting with our free analyst growth expectation chart.
- Other High Quality Alternatives: Do you like a good all-rounder? Explore our interactive list of high quality stocks to get an idea of what else is out there you may be missing!
PS. Simply Wall St updates its DCF calculation for every Singaporean stock every day, so if you want to find the intrinsic value of any other stock just search here.
New: Manage All Your Stock Portfolios in One Place
We've created the ultimate portfolio companion for stock investors, and it's free.
• Connect an unlimited number of Portfolios and see your total in one currency
• Be alerted to new Warning Signs or Risks via email or mobile
• Track the Fair Value of your stocks
Have feedback on this article? Concerned about the content? Get in touch with us directly. Alternatively, email editorial-team (at) simplywallst.com.
This article by Simply Wall St is general in nature. We provide commentary based on historical data and analyst forecasts only using an unbiased methodology and our articles are not intended to be financial advice. It does not constitute a recommendation to buy or sell any stock, and does not take account of your objectives, or your financial situation. We aim to bring you long-term focused analysis driven by fundamental data. Note that our analysis may not factor in the latest price-sensitive company announcements or qualitative material. Simply Wall St has no position in any stocks mentioned.
About SGX:BS6
Yangzijiang Shipbuilding (Holdings)
An investment holding company, engages in the shipbuilding activities in the Greater China, Canada, Japan, Italy, Greece, other European countries, and internationally.
Outstanding track record, undervalued and pays a dividend.

