
Advertisement
- Sweden
- /
- Electronic Equipment and Components
- /
- OM:PRIC B
Positive Sentiment Still Eludes Pricer AB (publ) (STO:PRIC B) Following 30% Share Price Slump
Unfortunately for some shareholders, the Pricer AB (publ) (STO:PRIC B) share price has dived 30% in the last thirty days, prolonging recent pain. Instead of being rewarded, shareholders who have already held through the last twelve months are now sitting on a 49% share price drop.
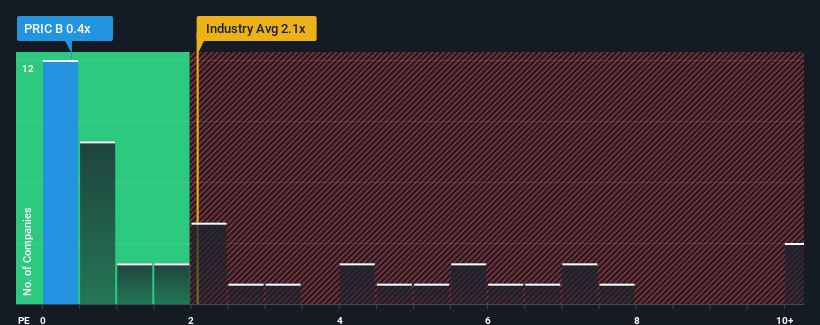
Since its price has dipped substantially, Pricer's price-to-sales (or "P/S") ratio of 0.4x might make it look like a buy right now compared to the Electronic industry in Sweden, where around half of the companies have P/S ratios above 2.1x and even P/S above 6x are quite common. However, the P/S might be low for a reason and it requires further investigation to determine if it's justified.
Our free stock report includes 1 warning sign investors should be aware of before investing in Pricer. Read for free now.View our latest analysis for Pricer
How Pricer Has Been Performing
As an illustration, revenue has deteriorated at Pricer over the last year, which is not ideal at all. Perhaps the market believes the recent revenue performance isn't good enough to keep up the industry, causing the P/S ratio to suffer. However, if this doesn't eventuate then existing shareholders may be feeling optimistic about the future direction of the share price.
Want the full picture on earnings, revenue and cash flow for the company? Then our free report on Pricer will help you shine a light on its historical performance.Is There Any Revenue Growth Forecasted For Pricer?
In order to justify its P/S ratio, Pricer would need to produce sluggish growth that's trailing the industry.
Taking a look back first, the company's revenue growth last year wasn't something to get excited about as it posted a disappointing decline of 4.6%. Still, the latest three year period has seen an excellent 39% overall rise in revenue, in spite of its unsatisfying short-term performance. Although it's been a bumpy ride, it's still fair to say the revenue growth recently has been more than adequate for the company.
When compared to the industry's one-year growth forecast of 5.3%, the most recent medium-term revenue trajectory is noticeably more alluring
With this in mind, we find it intriguing that Pricer's P/S isn't as high compared to that of its industry peers. Apparently some shareholders believe the recent performance has exceeded its limits and have been accepting significantly lower selling prices.
The Key Takeaway
The southerly movements of Pricer's shares means its P/S is now sitting at a pretty low level. Using the price-to-sales ratio alone to determine if you should sell your stock isn't sensible, however it can be a practical guide to the company's future prospects.
We're very surprised to see Pricer currently trading on a much lower than expected P/S since its recent three-year growth is higher than the wider industry forecast. When we see robust revenue growth that outpaces the industry, we presume that there are notable underlying risks to the company's future performance, which is exerting downward pressure on the P/S ratio. It appears many are indeed anticipating revenue instability, because the persistence of these recent medium-term conditions would normally provide a boost to the share price.
Plus, you should also learn about this 1 warning sign we've spotted with Pricer.
It's important to make sure you look for a great company, not just the first idea you come across. So if growing profitability aligns with your idea of a great company, take a peek at this free list of interesting companies with strong recent earnings growth (and a low P/E).
New: Manage All Your Stock Portfolios in One Place
We've created the ultimate portfolio companion for stock investors, and it's free.
• Connect an unlimited number of Portfolios and see your total in one currency
• Be alerted to new Warning Signs or Risks via email or mobile
• Track the Fair Value of your stocks
Have feedback on this article? Concerned about the content? Get in touch with us directly. Alternatively, email editorial-team (at) simplywallst.com.
This article by Simply Wall St is general in nature. We provide commentary based on historical data and analyst forecasts only using an unbiased methodology and our articles are not intended to be financial advice. It does not constitute a recommendation to buy or sell any stock, and does not take account of your objectives, or your financial situation. We aim to bring you long-term focused analysis driven by fundamental data. Note that our analysis may not factor in the latest price-sensitive company announcements or qualitative material. Simply Wall St has no position in any stocks mentioned.
About OM:PRIC B
Pricer
Provides in-store digital solutions in Europe, the Middle East and Africa, the Americas, and Asia and Pacific.
Good value with reasonable growth potential.
Similar Companies
Market Insights

Advertisement
Community Narratives
MicroVision will explode future revenue by 380.37% with a vision towards success
Fair Value US$60.00|98.5% undervalued
TH
Community Contributor
The Indispensable Artery for a New North American Economy
Fair Value CA$132.87|2.3% undervalued
TI
Community Contributor