
Advertisement
Legendary fund manager Li Lu (who Charlie Munger backed) once said, 'The biggest investment risk is not the volatility of prices, but whether you will suffer a permanent loss of capital.' So it seems the smart money knows that debt - which is usually involved in bankruptcies - is a very important factor, when you assess how risky a company is. As with many other companies Pricer AB (publ) (STO:PRIC B) makes use of debt. But should shareholders be worried about its use of debt?
What Risk Does Debt Bring?
Generally speaking, debt only becomes a real problem when a company can't easily pay it off, either by raising capital or with its own cash flow. Part and parcel of capitalism is the process of 'creative destruction' where failed businesses are mercilessly liquidated by their bankers. However, a more usual (but still expensive) situation is where a company must dilute shareholders at a cheap share price simply to get debt under control. By replacing dilution, though, debt can be an extremely good tool for businesses that need capital to invest in growth at high rates of return. The first step when considering a company's debt levels is to consider its cash and debt together.
See our latest analysis for Pricer
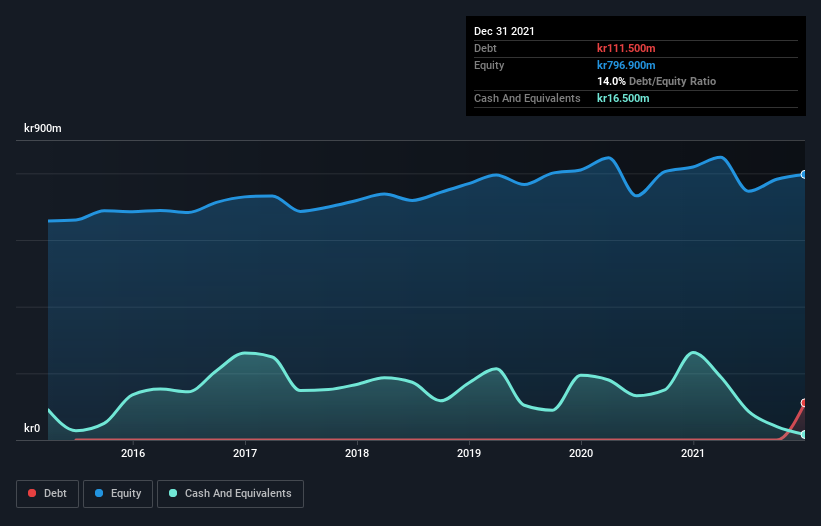
What Is Pricer's Debt?
The image below, which you can click on for greater detail, shows that at December 2021 Pricer had debt of kr111.5m, up from none in one year. However, it also had kr16.5m in cash, and so its net debt is kr95.0m.
How Healthy Is Pricer's Balance Sheet?
The latest balance sheet data shows that Pricer had liabilities of kr887.7m due within a year, and liabilities of kr46.1m falling due after that. Offsetting this, it had kr16.5m in cash and kr556.6m in receivables that were due within 12 months. So its liabilities outweigh the sum of its cash and (near-term) receivables by kr360.7m.
Of course, Pricer has a market capitalization of kr2.25b, so these liabilities are probably manageable. Having said that, it's clear that we should continue to monitor its balance sheet, lest it change for the worse.
We use two main ratios to inform us about debt levels relative to earnings. The first is net debt divided by earnings before interest, tax, depreciation, and amortization (EBITDA), while the second is how many times its earnings before interest and tax (EBIT) covers its interest expense (or its interest cover, for short). This way, we consider both the absolute quantum of the debt, as well as the interest rates paid on it.
Pricer has a low net debt to EBITDA ratio of only 0.67. And its EBIT covers its interest expense a whopping 40.5 times over. So you could argue it is no more threatened by its debt than an elephant is by a mouse. The modesty of its debt load may become crucial for Pricer if management cannot prevent a repeat of the 31% cut to EBIT over the last year. When it comes to paying off debt, falling earnings are no more useful than sugary sodas are for your health. When analysing debt levels, the balance sheet is the obvious place to start. But ultimately the future profitability of the business will decide if Pricer can strengthen its balance sheet over time. So if you're focused on the future you can check out this free report showing analyst profit forecasts.
Finally, while the tax-man may adore accounting profits, lenders only accept cold hard cash. So we always check how much of that EBIT is translated into free cash flow. In the last three years, Pricer created free cash flow amounting to 16% of its EBIT, an uninspiring performance. That limp level of cash conversion undermines its ability to manage and pay down debt.
Our View
Neither Pricer's ability to grow its EBIT nor its conversion of EBIT to free cash flow gave us confidence in its ability to take on more debt. But the good news is it seems to be able to cover its interest expense with its EBIT with ease. We think that Pricer's debt does make it a bit risky, after considering the aforementioned data points together. That's not necessarily a bad thing, since leverage can boost returns on equity, but it is something to be aware of. There's no doubt that we learn most about debt from the balance sheet. However, not all investment risk resides within the balance sheet - far from it. Case in point: We've spotted 4 warning signs for Pricer you should be aware of, and 2 of them make us uncomfortable.
If, after all that, you're more interested in a fast growing company with a rock-solid balance sheet, then check out our list of net cash growth stocks without delay.
New: Manage All Your Stock Portfolios in One Place
We've created the ultimate portfolio companion for stock investors, and it's free.
• Connect an unlimited number of Portfolios and see your total in one currency
• Be alerted to new Warning Signs or Risks via email or mobile
• Track the Fair Value of your stocks
Have feedback on this article? Concerned about the content? Get in touch with us directly. Alternatively, email editorial-team (at) simplywallst.com.
This article by Simply Wall St is general in nature. We provide commentary based on historical data and analyst forecasts only using an unbiased methodology and our articles are not intended to be financial advice. It does not constitute a recommendation to buy or sell any stock, and does not take account of your objectives, or your financial situation. We aim to bring you long-term focused analysis driven by fundamental data. Note that our analysis may not factor in the latest price-sensitive company announcements or qualitative material. Simply Wall St has no position in any stocks mentioned.
About OM:PRIC B
Pricer
Provides in-store digital solutions in Europe, the Middle East and Africa, the Americas, and Asia and Pacific.
Adequate balance sheet with very low risk.
Similar Companies
Market Insights

Advertisement
Community Narratives
The Next Phase of Energy Storage: How NeoVolta Is Tackling America’s Power Crunch
Fair Value US$7.50|35.1% undervalued
MA
Community Contributor
Why EnSilica is Worth Possibly 13x its Current Price
Fair Value UK£5.00|89.8% undervalued
DO
Community Contributor
M&A Activity, Industry Diversification & A Defense Contract Monopoly Will Push BWXT For Healthy Long-Term Growth
Fair Value US$220.00|15.2% undervalued
CL
Community Contributor
A case for Cassiar Gold Corp (TSXV: GLDC) to reach CAD$8-10 before 2030 (X30-37)
Fair Value CA$10.00|96.0% undervalued
AG
Community Contributor