We can readily understand why investors are attracted to unprofitable companies. For example, although Amazon.com made losses for many years after listing, if you had bought and held the shares since 1999, you would have made a fortune. But the harsh reality is that very many loss making companies burn through all their cash and go bankrupt.
So should Gapwaves (STO:GAPW B) shareholders be worried about its cash burn? In this article, we define cash burn as its annual (negative) free cash flow, which is the amount of money a company spends each year to fund its growth. We'll start by comparing its cash burn with its cash reserves in order to calculate its cash runway.
See our latest analysis for Gapwaves
How Long Is Gapwaves' Cash Runway?
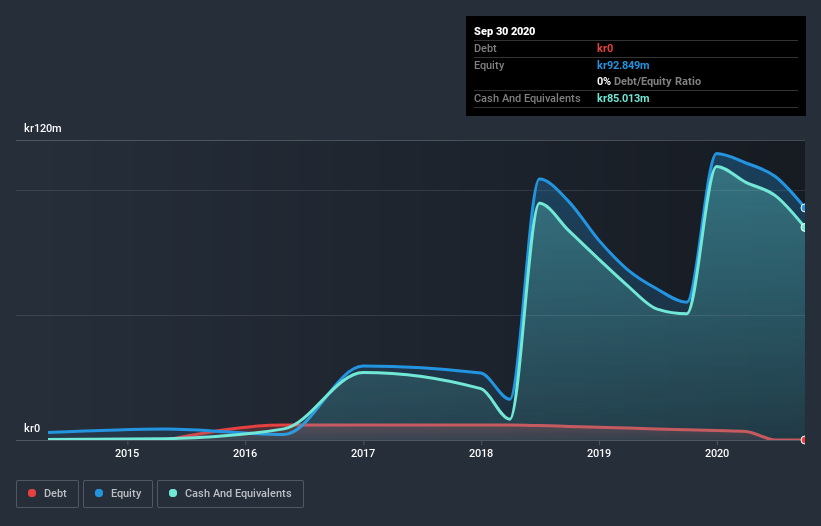
A company's cash runway is the amount of time it would take to burn through its cash reserves at its current cash burn rate. As at September 2020, Gapwaves had cash of kr85m and no debt. Importantly, its cash burn was kr42m over the trailing twelve months. That means it had a cash runway of about 2.0 years as of September 2020. Arguably, that's a prudent and sensible length of runway to have. You can see how its cash balance has changed over time in the image below.

How Well Is Gapwaves Growing?
At first glance it's a bit worrying to see that Gapwaves actually boosted its cash burn by 32%, year on year. Having said that, it's revenue is up a very solid 65% in the last year, so there's plenty of reason to believe in the growth story. The company needs to keep up that growth, if it is to really please shareholders. It seems to be growing nicely. In reality, this article only makes a short study of the company's growth data. This graph of historic revenue growth shows how Gapwaves is building its business over time.
Can Gapwaves Raise More Cash Easily?
While Gapwaves seems to be in a fairly good position, it's still worth considering how easily it could raise more cash, even just to fuel faster growth. Companies can raise capital through either debt or equity. Many companies end up issuing new shares to fund future growth. By comparing a company's annual cash burn to its total market capitalisation, we can estimate roughly how many shares it would have to issue in order to run the company for another year (at the same burn rate).
Since it has a market capitalisation of kr1.5b, Gapwaves' kr42m in cash burn equates to about 2.8% of its market value. So it could almost certainly just borrow a little to fund another year's growth, or else easily raise the cash by issuing a few shares.
How Risky Is Gapwaves' Cash Burn Situation?
As you can probably tell by now, we're not too worried about Gapwaves' cash burn. For example, we think its revenue growth suggests that the company is on a good path. While its increasing cash burn wasn't great, the other factors mentioned in this article more than make up for weakness on that measure. Based on the factors mentioned in this article, we think its cash burn situation warrants some attention from shareholders, but we don't think they should be worried. On another note, Gapwaves has 4 warning signs (and 1 which is a bit unpleasant) we think you should know about.
Of course, you might find a fantastic investment by looking elsewhere. So take a peek at this free list of interesting companies, and this list of stocks growth stocks (according to analyst forecasts)
If you decide to trade Gapwaves, use the lowest-cost* platform that is rated #1 Overall by Barron’s, Interactive Brokers. Trade stocks, options, futures, forex, bonds and funds on 135 markets, all from a single integrated account. Promoted
New: Manage All Your Stock Portfolios in One Place
We've created the ultimate portfolio companion for stock investors, and it's free.
• Connect an unlimited number of Portfolios and see your total in one currency
• Be alerted to new Warning Signs or Risks via email or mobile
• Track the Fair Value of your stocks
This article by Simply Wall St is general in nature. It does not constitute a recommendation to buy or sell any stock, and does not take account of your objectives, or your financial situation. We aim to bring you long-term focused analysis driven by fundamental data. Note that our analysis may not factor in the latest price-sensitive company announcements or qualitative material. Simply Wall St has no position in any stocks mentioned.
*Interactive Brokers Rated Lowest Cost Broker by StockBrokers.com Annual Online Review 2020
Have feedback on this article? Concerned about the content? Get in touch with us directly. Alternatively, email editorial-team (at) simplywallst.com.
About OM:GAPW B
Gapwaves
Designs, develops, manufactures, and delivers waveguide products in Sweden, rest of European Union, and internationally.
Flawless balance sheet with high growth potential.
Market Insights
Weekly Picks

THE KINGDOM OF BROWN GOODS: WHY MGPI IS BEING CRUSHED BY INVENTORY & PRIMED FOR RESURRECTION


Why Vertical Aerospace (NYSE: EVTL) is Worth Possibly Over 13x its Current Price


The Quiet Giant That Became AI’s Power Grid
Recently Updated Narratives

Growing between 25-50% for the next 3-5 years

SLI is share to watch next 5 years


The "Molecular Pencil": Why Beam's Technology is Built to Win
Popular Narratives


MicroVision will explode future revenue by 380.37% with a vision towards success


NVDA: Expanding AI Demand Will Drive Major Data Center Investments Through 2026


