
Advertisement
- Sweden
- /
- Electronic Equipment and Components
- /
- OM:FING B
Fingerprint Cards AB (publ) (STO:FING B) Stock's 46% Dive Might Signal An Opportunity But It Requires Some Scrutiny
Unfortunately for some shareholders, the Fingerprint Cards AB (publ) (STO:FING B) share price has dived 46% in the last thirty days, prolonging recent pain. The recent drop completes a disastrous twelve months for shareholders, who are sitting on a 79% loss during that time.
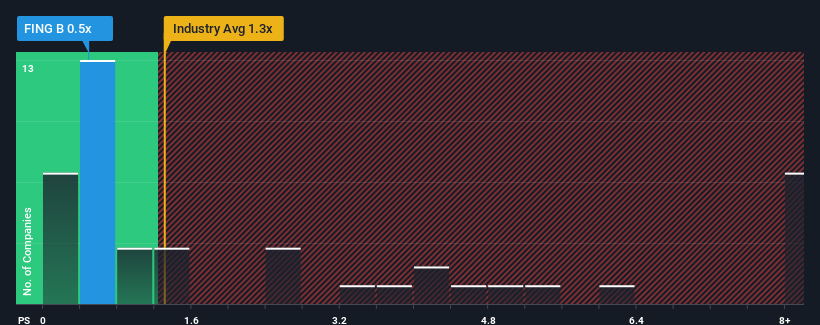
After such a large drop in price, Fingerprint Cards' price-to-sales (or "P/S") ratio of 0.5x might make it look like a buy right now compared to the Electronic industry in Sweden, where around half of the companies have P/S ratios above 1.3x and even P/S above 5x are quite common. Nonetheless, we'd need to dig a little deeper to determine if there is a rational basis for the reduced P/S.
View our latest analysis for Fingerprint Cards
How Fingerprint Cards Has Been Performing
Fingerprint Cards could be doing better as its revenue has been going backwards lately while most other companies have been seeing positive revenue growth. The P/S ratio is probably low because investors think this poor revenue performance isn't going to get any better. If this is the case, then existing shareholders will probably struggle to get excited about the future direction of the share price.
If you'd like to see what analysts are forecasting going forward, you should check out our free report on Fingerprint Cards.What Are Revenue Growth Metrics Telling Us About The Low P/S?
The only time you'd be truly comfortable seeing a P/S as low as Fingerprint Cards' is when the company's growth is on track to lag the industry.
Taking a look back first, the company's revenue growth last year wasn't something to get excited about as it posted a disappointing decline of 18%. The last three years don't look nice either as the company has shrunk revenue by 44% in aggregate. So unfortunately, we have to acknowledge that the company has not done a great job of growing revenue over that time.
Turning to the outlook, the next three years should generate growth of 31% per year as estimated by the only analyst watching the company. With the industry only predicted to deliver 8.7% per year, the company is positioned for a stronger revenue result.
With this information, we find it odd that Fingerprint Cards is trading at a P/S lower than the industry. Apparently some shareholders are doubtful of the forecasts and have been accepting significantly lower selling prices.
The Final Word
The southerly movements of Fingerprint Cards' shares means its P/S is now sitting at a pretty low level. Typically, we'd caution against reading too much into price-to-sales ratios when settling on investment decisions, though it can reveal plenty about what other market participants think about the company.
To us, it seems Fingerprint Cards currently trades on a significantly depressed P/S given its forecasted revenue growth is higher than the rest of its industry. When we see strong growth forecasts like this, we can only assume potential risks are what might be placing significant pressure on the P/S ratio. It appears the market could be anticipating revenue instability, because these conditions should normally provide a boost to the share price.
It is also worth noting that we have found 3 warning signs for Fingerprint Cards (1 doesn't sit too well with us!) that you need to take into consideration.
Of course, profitable companies with a history of great earnings growth are generally safer bets. So you may wish to see this free collection of other companies that have reasonable P/E ratios and have grown earnings strongly.
New: AI Stock Screener & Alerts
Our new AI Stock Screener scans the market every day to uncover opportunities.
• Dividend Powerhouses (3%+ Yield)
• Undervalued Small Caps with Insider Buying
• High growth Tech and AI Companies
Or build your own from over 50 metrics.
Have feedback on this article? Concerned about the content? Get in touch with us directly. Alternatively, email editorial-team (at) simplywallst.com.
This article by Simply Wall St is general in nature. We provide commentary based on historical data and analyst forecasts only using an unbiased methodology and our articles are not intended to be financial advice. It does not constitute a recommendation to buy or sell any stock, and does not take account of your objectives, or your financial situation. We aim to bring you long-term focused analysis driven by fundamental data. Note that our analysis may not factor in the latest price-sensitive company announcements or qualitative material. Simply Wall St has no position in any stocks mentioned.
About OM:FING B
Fingerprint Cards
A biometrics company, engages in the development, production, and marketing of biometric systems in Sweden, France, Hong Kong, China, the United States, and internationally.
Flawless balance sheet with slight risk.
Similar Companies
Market Insights

Advertisement
Community Narratives
MicroVision will explode future revenue by 380.37% with a vision towards success
Fair Value US$60.00|98.4% undervalued
TH
Community Contributor
The Indispensable Artery for a New North American Economy
Fair Value CA$132.87|1.3% undervalued
TI
Community Contributor