A Piece Of The Puzzle Missing From 4C Group AB (publ)'s (STO:4C) 27% Share Price Climb
4C Group AB (publ) (STO:4C) shares have continued their recent momentum with a 27% gain in the last month alone. Unfortunately, the gains of the last month did little to right the losses of the last year with the stock still down 20% over that time.
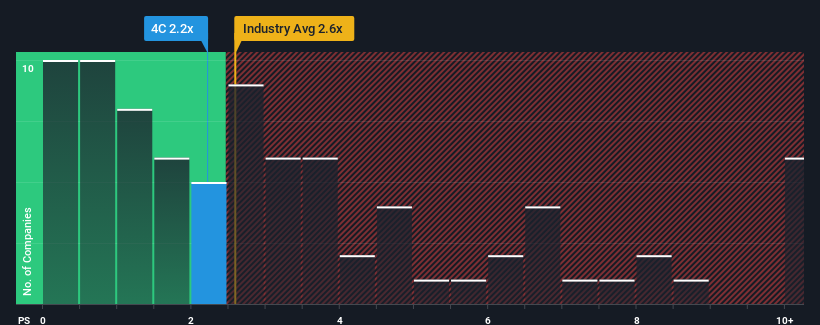
In spite of the firm bounce in price, there still wouldn't be many who think 4C Group's price-to-sales (or "P/S") ratio of 2.2x is worth a mention when the median P/S in Sweden's Software industry is similar at about 2.6x. Although, it's not wise to simply ignore the P/S without explanation as investors may be disregarding a distinct opportunity or a costly mistake.
See our latest analysis for 4C Group

How Has 4C Group Performed Recently?
4C Group could be doing better as it's been growing revenue less than most other companies lately. Perhaps the market is expecting future revenue performance to lift, which has kept the P/S from declining. If not, then existing shareholders may be a little nervous about the viability of the share price.
If you'd like to see what analysts are forecasting going forward, you should check out our free report on 4C Group.How Is 4C Group's Revenue Growth Trending?
There's an inherent assumption that a company should be matching the industry for P/S ratios like 4C Group's to be considered reasonable.
If we review the last year of revenue growth, the company posted a worthy increase of 3.3%. The latest three year period has also seen an excellent 31% overall rise in revenue, aided somewhat by its short-term performance. Accordingly, shareholders would have definitely welcomed those medium-term rates of revenue growth.
Looking ahead now, revenue is anticipated to climb by 33% during the coming year according to the lone analyst following the company. With the industry only predicted to deliver 19%, the company is positioned for a stronger revenue result.
In light of this, it's curious that 4C Group's P/S sits in line with the majority of other companies. Apparently some shareholders are skeptical of the forecasts and have been accepting lower selling prices.
The Bottom Line On 4C Group's P/S
Its shares have lifted substantially and now 4C Group's P/S is back within range of the industry median. Using the price-to-sales ratio alone to determine if you should sell your stock isn't sensible, however it can be a practical guide to the company's future prospects.
Looking at 4C Group's analyst forecasts revealed that its superior revenue outlook isn't giving the boost to its P/S that we would've expected. When we see a strong revenue outlook, with growth outpacing the industry, we can only assume potential uncertainty around these figures are what might be placing slight pressure on the P/S ratio. It appears some are indeed anticipating revenue instability, because these conditions should normally provide a boost to the share price.
Don't forget that there may be other risks. For instance, we've identified 2 warning signs for 4C Group (1 is a bit unpleasant) you should be aware of.
If these risks are making you reconsider your opinion on 4C Group, explore our interactive list of high quality stocks to get an idea of what else is out there.
New: AI Stock Screener & Alerts
Our new AI Stock Screener scans the market every day to uncover opportunities.
• Dividend Powerhouses (3%+ Yield)
• Undervalued Small Caps with Insider Buying
• High growth Tech and AI Companies
Or build your own from over 50 metrics.
Have feedback on this article? Concerned about the content? Get in touch with us directly. Alternatively, email editorial-team (at) simplywallst.com.
This article by Simply Wall St is general in nature. We provide commentary based on historical data and analyst forecasts only using an unbiased methodology and our articles are not intended to be financial advice. It does not constitute a recommendation to buy or sell any stock, and does not take account of your objectives, or your financial situation. We aim to bring you long-term focused analysis driven by fundamental data. Note that our analysis may not factor in the latest price-sensitive company announcements or qualitative material. Simply Wall St has no position in any stocks mentioned.
About OM:4C
4C Group
Provides software solutions and expert services for organizational readiness, training, and crisis management worldwide.
Mediocre balance sheet with low risk.
Market Insights
Weekly Picks


Crazy Undervalued 42 Baggers Silver Play (Active & Running Mine)


Fiducian: Compliance Clouds or Value Opportunity?

Willamette Valley Vineyards (WVVI): Not-So-Great Value
Recently Updated Narratives

THE KINGDOM OF BROWN GOODS: WHY MGPI IS BEING CRUSHED BY INVENTORY & PRIMED FOR RESURRECTION


The "Molecular Pencil": Why Beam's Technology is Built to Win


ADNOC Gas future shines with a 21.4% revenue surge
Popular Narratives


MicroVision will explode future revenue by 380.37% with a vision towards success


NVDA: Expanding AI Demand Will Drive Major Data Center Investments Through 2026


