- Sweden
- /
- Specialty Stores
- /
- OM:NELLY
Earnings Not Telling The Story For Nelly Group AB (publ) (STO:NELLY) After Shares Rise 25%

Despite an already strong run, Nelly Group AB (publ) (STO:NELLY) shares have been powering on, with a gain of 25% in the last thirty days. The last 30 days were the cherry on top of the stock's 304% gain in the last year, which is nothing short of spectacular.
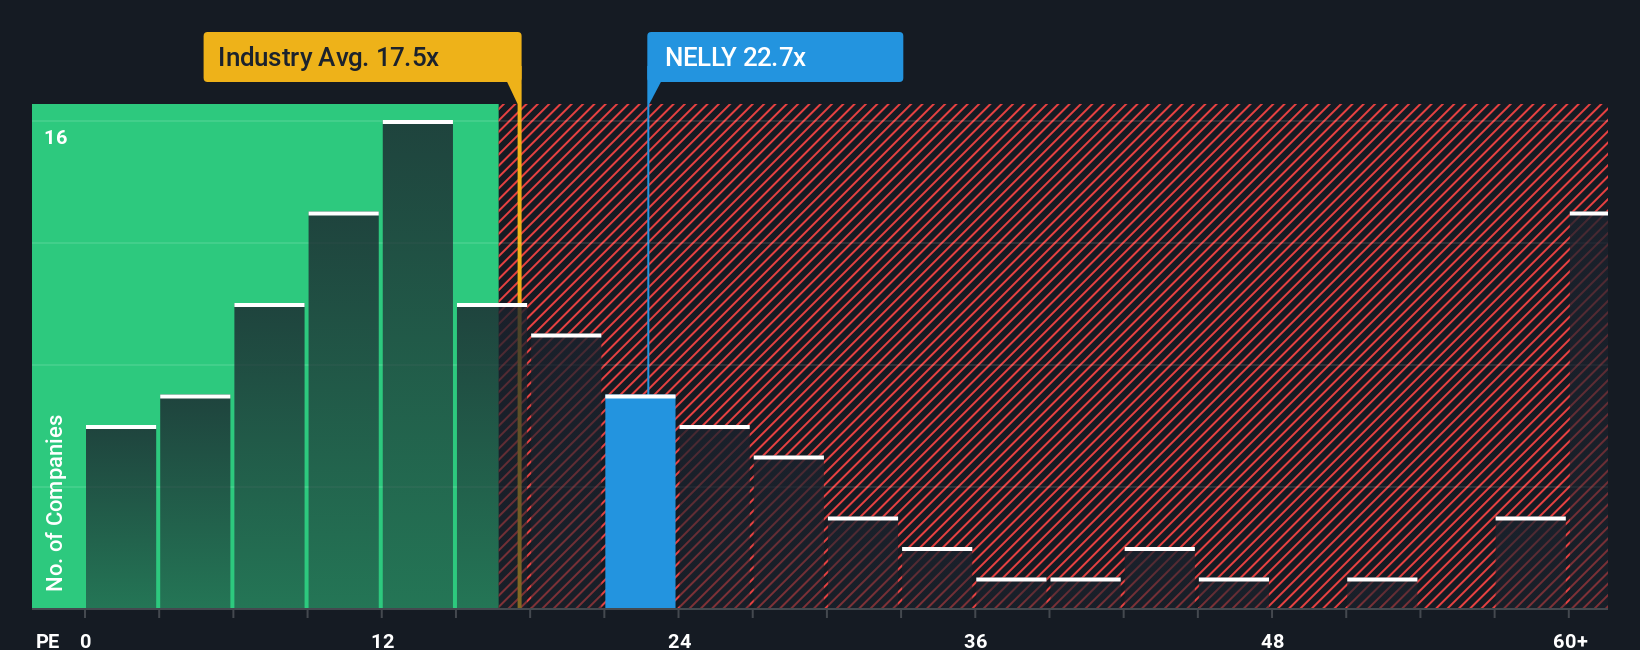
In spite of the firm bounce in price, it's still not a stretch to say that Nelly Group's price-to-earnings (or "P/E") ratio of 22.7x right now seems quite "middle-of-the-road" compared to the market in Sweden, where the median P/E ratio is around 22x. However, investors might be overlooking a clear opportunity or potential setback if there is no rational basis for the P/E.
With earnings growth that's exceedingly strong of late, Nelly Group has been doing very well. It might be that many expect the strong earnings performance to wane, which has kept the P/E from rising. If that doesn't eventuate, then existing shareholders have reason to be feeling optimistic about the future direction of the share price.
Check out our latest analysis for Nelly Group
What Are Growth Metrics Telling Us About The P/E?
There's an inherent assumption that a company should be matching the market for P/E ratios like Nelly Group's to be considered reasonable.
If we review the last year of earnings growth, the company posted a terrific increase of 119%. However, the latest three year period hasn't been as great in aggregate as it didn't manage to provide any growth at all. So it appears to us that the company has had a mixed result in terms of growing earnings over that time.
Comparing that to the market, which is predicted to deliver 30% growth in the next 12 months, the company's momentum is weaker based on recent medium-term annualised earnings results.
In light of this, it's curious that Nelly Group's P/E sits in line with the majority of other companies. It seems most investors are ignoring the fairly limited recent growth rates and are willing to pay up for exposure to the stock. They may be setting themselves up for future disappointment if the P/E falls to levels more in line with recent growth rates.
The Final Word
Nelly Group appears to be back in favour with a solid price jump getting its P/E back in line with most other companies. We'd say the price-to-earnings ratio's power isn't primarily as a valuation instrument but rather to gauge current investor sentiment and future expectations.
Our examination of Nelly Group revealed its three-year earnings trends aren't impacting its P/E as much as we would have predicted, given they look worse than current market expectations. When we see weak earnings with slower than market growth, we suspect the share price is at risk of declining, sending the moderate P/E lower. Unless the recent medium-term conditions improve, it's challenging to accept these prices as being reasonable.
You always need to take note of risks, for example - Nelly Group has 1 warning sign we think you should be aware of.
Of course, you might find a fantastic investment by looking at a few good candidates. So take a peek at this free list of companies with a strong growth track record, trading on a low P/E.
Mobile Infrastructure for Defense and Disaster
The next wave in robotics isn't humanoid. Its fully autonomous towers delivering 5G, ISR, and radar in under 30 minutes, anywhere.
Get the investor briefing before the next round of contracts
Sponsored On Behalf of CiTechValuation is complex, but we're here to simplify it.
Discover if Nelly Group might be undervalued or overvalued with our detailed analysis, featuring fair value estimates, potential risks, dividends, insider trades, and its financial condition.
Access Free AnalysisHave feedback on this article? Concerned about the content? Get in touch with us directly. Alternatively, email editorial-team (at) simplywallst.com.
This article by Simply Wall St is general in nature. We provide commentary based on historical data and analyst forecasts only using an unbiased methodology and our articles are not intended to be financial advice. It does not constitute a recommendation to buy or sell any stock, and does not take account of your objectives, or your financial situation. We aim to bring you long-term focused analysis driven by fundamental data. Note that our analysis may not factor in the latest price-sensitive company announcements or qualitative material. Simply Wall St has no position in any stocks mentioned.
About OM:NELLY
Nelly Group
Operates as a fashion company in Sweden, rest of Nordics, and internationally.
Flawless balance sheet with solid track record.
Market Insights

Weekly Picks

Early mover in a fast growing industry. Likely to experience share price volatility as they scale


A case for CA$31.80 (undiluted), aka 8,616% upside from CA$0.37 (an 86 bagger!).


Moderation and Stabilisation: HOLD: Fair Price based on a 4-year Cycle is $12.08
Recently Updated Narratives


An amazing opportunity to potentially get a 100 bagger

Amazon: Why the World’s Biggest Platform Still Runs on Invisible Economics

Sunrun Stock: When the Energy Transition Collides With the Cost of Capital
Popular Narratives


MicroVision will explode future revenue by 380.37% with a vision towards success


Crazy Undervalued 42 Baggers Silver Play (Active & Running Mine)

