Is Vicore Pharma Holding (STO:VICO) In A Good Position To Invest In Growth?


There's no doubt that money can be made by owning shares of unprofitable businesses. For example, although Amazon.com made losses for many years after listing, if you had bought and held the shares since 1999, you would have made a fortune. But while the successes are well known, investors should not ignore the very many unprofitable companies that simply burn through all their cash and collapse.
So, the natural question for Vicore Pharma Holding (STO:VICO) shareholders is whether they should be concerned by its rate of cash burn. In this report, we will consider the company's annual negative free cash flow, henceforth referring to it as the 'cash burn'. First, we'll determine its cash runway by comparing its cash burn with its cash reserves.
Check out the opportunities and risks within the SE Biotechs industry.
When Might Vicore Pharma Holding Run Out Of Money?
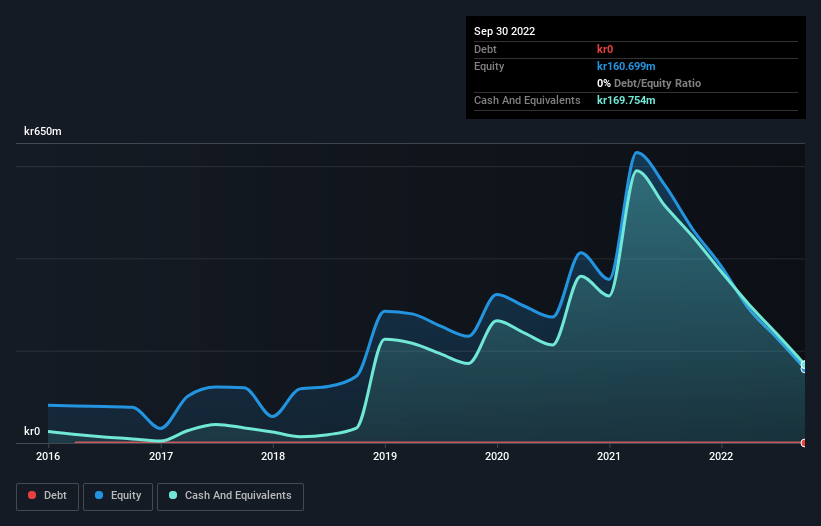
A company's cash runway is the amount of time it would take to burn through its cash reserves at its current cash burn rate. As at September 2022, Vicore Pharma Holding had cash of kr170m and no debt. Importantly, its cash burn was kr278m over the trailing twelve months. So it had a cash runway of approximately 7 months from September 2022. That's quite a short cash runway, indicating the company must either reduce its annual cash burn or replenish its cash. The image below shows how its cash balance has been changing over the last few years.
How Is Vicore Pharma Holding's Cash Burn Changing Over Time?
Because Vicore Pharma Holding isn't currently generating revenue, we consider it an early-stage business. So while we can't look to sales to understand growth, we can look at how the cash burn is changing to understand how expenditure is trending over time. With the cash burn rate up 20% in the last year, it seems that the company is ratcheting up investment in the business over time. However, the company's true cash runway will therefore be shorter than suggested above, if spending continues to increase. While the past is always worth studying, it is the future that matters most of all. So you might want to take a peek at how much the company is expected to grow in the next few years.
How Easily Can Vicore Pharma Holding Raise Cash?
Given its cash burn trajectory, Vicore Pharma Holding shareholders should already be thinking about how easy it might be for it to raise further cash in the future. Issuing new shares, or taking on debt, are the most common ways for a listed company to raise more money for its business. Commonly, a business will sell new shares in itself to raise cash and drive growth. By comparing a company's annual cash burn to its total market capitalisation, we can estimate roughly how many shares it would have to issue in order to run the company for another year (at the same burn rate).
Vicore Pharma Holding's cash burn of kr278m is about 15% of its kr1.9b market capitalisation. As a result, we'd venture that the company could raise more cash for growth without much trouble, albeit at the cost of some dilution.
So, Should We Worry About Vicore Pharma Holding's Cash Burn?
On this analysis of Vicore Pharma Holding's cash burn, we think its cash burn relative to its market cap was reassuring, while its cash runway has us a bit worried. Summing up, we think the Vicore Pharma Holding's cash burn is a risk, based on the factors we mentioned in this article. On another note, Vicore Pharma Holding has 4 warning signs (and 2 which shouldn't be ignored) we think you should know about.
Of course Vicore Pharma Holding may not be the best stock to buy. So you may wish to see this free collection of companies boasting high return on equity, or this list of stocks that insiders are buying.
New: Manage All Your Stock Portfolios in One Place
We've created the ultimate portfolio companion for stock investors, and it's free.
• Connect an unlimited number of Portfolios and see your total in one currency
• Be alerted to new Warning Signs or Risks via email or mobile
• Track the Fair Value of your stocks
Have feedback on this article? Concerned about the content? Get in touch with us directly. Alternatively, email editorial-team (at) simplywallst.com.
This article by Simply Wall St is general in nature. We provide commentary based on historical data and analyst forecasts only using an unbiased methodology and our articles are not intended to be financial advice. It does not constitute a recommendation to buy or sell any stock, and does not take account of your objectives, or your financial situation. We aim to bring you long-term focused analysis driven by fundamental data. Note that our analysis may not factor in the latest price-sensitive company announcements or qualitative material. Simply Wall St has no position in any stocks mentioned.
About OM:VICO
Vicore Pharma Holding
A clinical-stage pharmaceutical company, develops therapies for the treatment of respiratory diseases in Sweden.
Flawless balance sheet with high growth potential.
Market Insights

Community Narratives

