
Advertisement
Sprint Bioscience AB (publ)'s (STO:SPRINT) Stock's On An Uptrend: Are Strong Financials Guiding The Market?
Most readers would already be aware that Sprint Bioscience's (STO:SPRINT) stock increased significantly by 51% over the past three months. Since the market usually pay for a company’s long-term fundamentals, we decided to study the company’s key performance indicators to see if they could be influencing the market. Particularly, we will be paying attention to Sprint Bioscience's ROE today.
Return on equity or ROE is a key measure used to assess how efficiently a company's management is utilizing the company's capital. In other words, it is a profitability ratio which measures the rate of return on the capital provided by the company's shareholders.
See our latest analysis for Sprint Bioscience
How To Calculate Return On Equity?
ROE can be calculated by using the formula:
Return on Equity = Net Profit (from continuing operations) ÷ Shareholders' Equity
So, based on the above formula, the ROE for Sprint Bioscience is:
36% = kr8.8m ÷ kr25m (Based on the trailing twelve months to March 2024).
The 'return' is the yearly profit. So, this means that for every SEK1 of its shareholder's investments, the company generates a profit of SEK0.36.
What Has ROE Got To Do With Earnings Growth?
We have already established that ROE serves as an efficient profit-generating gauge for a company's future earnings. Based on how much of its profits the company chooses to reinvest or "retain", we are then able to evaluate a company's future ability to generate profits. Assuming all else is equal, companies that have both a higher return on equity and higher profit retention are usually the ones that have a higher growth rate when compared to companies that don't have the same features.
Sprint Bioscience's Earnings Growth And 36% ROE
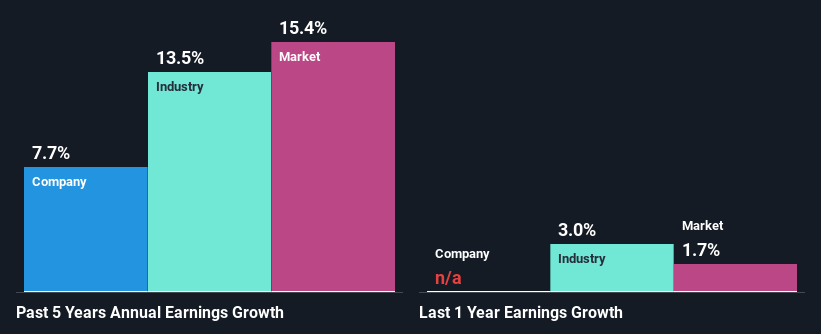
To begin with, Sprint Bioscience has a pretty high ROE which is interesting. Second, a comparison with the average ROE reported by the industry of 9.8% also doesn't go unnoticed by us. This probably laid the groundwork for Sprint Bioscience's moderate 7.7% net income growth seen over the past five years.
As a next step, we compared Sprint Bioscience's net income growth with the industry and were disappointed to see that the company's growth is lower than the industry average growth of 14% in the same period.
Earnings growth is a huge factor in stock valuation. What investors need to determine next is if the expected earnings growth, or the lack of it, is already built into the share price. This then helps them determine if the stock is placed for a bright or bleak future. One good indicator of expected earnings growth is the P/E ratio which determines the price the market is willing to pay for a stock based on its earnings prospects. So, you may want to check if Sprint Bioscience is trading on a high P/E or a low P/E, relative to its industry.
Is Sprint Bioscience Efficiently Re-investing Its Profits?
Given that Sprint Bioscience doesn't pay any regular dividends to its shareholders, we infer that the company has been reinvesting all of its profits to grow its business.
Conclusion
In total, we are pretty happy with Sprint Bioscience's performance. Particularly, we like that the company is reinvesting heavily into its business, and at a high rate of return. As a result, the decent growth in its earnings is not surprising. If the company continues to grow its earnings the way it has, that could have a positive impact on its share price given how earnings per share influence long-term share prices. Not to forget, share price outcomes are also dependent on the potential risks a company may face. So it is important for investors to be aware of the risks involved in the business. To know the 2 risks we have identified for Sprint Bioscience visit our risks dashboard for free.
New: Manage All Your Stock Portfolios in One Place
We've created the ultimate portfolio companion for stock investors, and it's free.
• Connect an unlimited number of Portfolios and see your total in one currency
• Be alerted to new Warning Signs or Risks via email or mobile
• Track the Fair Value of your stocks
Have feedback on this article? Concerned about the content? Get in touch with us directly. Alternatively, email editorial-team (at) simplywallst.com.
This article by Simply Wall St is general in nature. We provide commentary based on historical data and analyst forecasts only using an unbiased methodology and our articles are not intended to be financial advice. It does not constitute a recommendation to buy or sell any stock, and does not take account of your objectives, or your financial situation. We aim to bring you long-term focused analysis driven by fundamental data. Note that our analysis may not factor in the latest price-sensitive company announcements or qualitative material. Simply Wall St has no position in any stocks mentioned.
About OM:SPRINT
Sprint Bioscience
A pharmaceutical company, engages in the development of pharmaceutical products in the areas of cancer in Sweden.
Undervalued with adequate balance sheet.
Market Insights

Advertisement
Community Narratives
Quality at a Premium. A time to watch, not to buy?
Fair Value US$154.56|30.1% undervalued
DA
Community Contributor
GRAB: The Super-App at the Heart of Southeast Asia’s Digital Boom
Fair Value US$8.20|25.6% undervalued
BL
Community Contributor
Verve Group to Surge with 51.61% Revenue Growth
Fair Value €6.00|63.2% undervalued
ME
Community Contributor