- Sweden
- /
- Life Sciences
- /
- OM:MCAP
MedCap AB (publ)'s (STO:MCAP) P/E Is Still On The Mark Following 25% Share Price Bounce
Despite an already strong run, MedCap AB (publ) (STO:MCAP) shares have been powering on, with a gain of 25% in the last thirty days. The last 30 days bring the annual gain to a very sharp 64%.
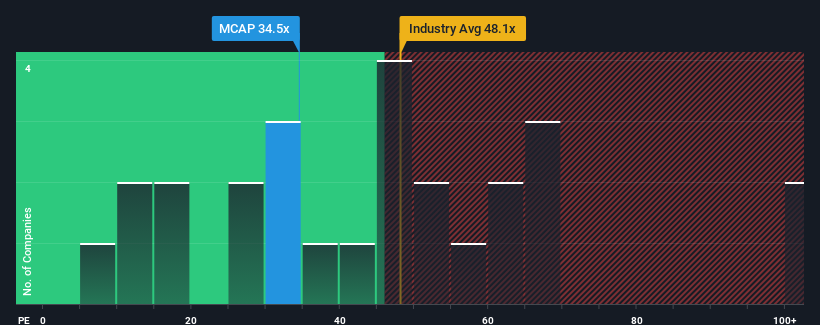
After such a large jump in price, given close to half the companies in Sweden have price-to-earnings ratios (or "P/E's") below 21x, you may consider MedCap as a stock to avoid entirely with its 34.5x P/E ratio. However, the P/E might be quite high for a reason and it requires further investigation to determine if it's justified.
With earnings growth that's exceedingly strong of late, MedCap has been doing very well. The P/E is probably high because investors think this strong earnings growth will be enough to outperform the broader market in the near future. You'd really hope so, otherwise you're paying a pretty hefty price for no particular reason.
Check out our latest analysis for MedCap

How Is MedCap's Growth Trending?
The only time you'd be truly comfortable seeing a P/E as steep as MedCap's is when the company's growth is on track to outshine the market decidedly.
If we review the last year of earnings growth, the company posted a terrific increase of 46%. Pleasingly, EPS has also lifted 167% in aggregate from three years ago, thanks to the last 12 months of growth. Therefore, it's fair to say the earnings growth recently has been superb for the company.
Comparing that to the market, which is only predicted to deliver 27% growth in the next 12 months, the company's momentum is stronger based on recent medium-term annualised earnings results.
With this information, we can see why MedCap is trading at such a high P/E compared to the market. It seems most investors are expecting this strong growth to continue and are willing to pay more for the stock.
The Key Takeaway
MedCap's P/E is flying high just like its stock has during the last month. We'd say the price-to-earnings ratio's power isn't primarily as a valuation instrument but rather to gauge current investor sentiment and future expectations.
We've established that MedCap maintains its high P/E on the strength of its recent three-year growth being higher than the wider market forecast, as expected. At this stage investors feel the potential for a deterioration in earnings isn't great enough to justify a lower P/E ratio. If recent medium-term earnings trends continue, it's hard to see the share price falling strongly in the near future under these circumstances.
Many other vital risk factors can be found on the company's balance sheet. Take a look at our free balance sheet analysis for MedCap with six simple checks on some of these key factors.
If P/E ratios interest you, you may wish to see this free collection of other companies with strong earnings growth and low P/E ratios.
New: Manage All Your Stock Portfolios in One Place
We've created the ultimate portfolio companion for stock investors, and it's free.
• Connect an unlimited number of Portfolios and see your total in one currency
• Be alerted to new Warning Signs or Risks via email or mobile
• Track the Fair Value of your stocks
Have feedback on this article? Concerned about the content? Get in touch with us directly. Alternatively, email editorial-team (at) simplywallst.com.
This article by Simply Wall St is general in nature. We provide commentary based on historical data and analyst forecasts only using an unbiased methodology and our articles are not intended to be financial advice. It does not constitute a recommendation to buy or sell any stock, and does not take account of your objectives, or your financial situation. We aim to bring you long-term focused analysis driven by fundamental data. Note that our analysis may not factor in the latest price-sensitive company announcements or qualitative material. Simply Wall St has no position in any stocks mentioned.
About OM:MCAP
MedCap
A private equity firm specializing in investments in secondary direct, later stage, industry consolidation, add-on acquisitions, growth capital, middle market, mature, turnarounds, buyout.
Flawless balance sheet with moderate growth potential.
Market Insights
Weekly Picks


Crazy Undervalued 42 Baggers Silver Play (Active & Running Mine)


Fiducian: Compliance Clouds or Value Opportunity?

Willamette Valley Vineyards (WVVI): Not-So-Great Value
Recently Updated Narratives

PSIX The timing of insider sales is a serious question mark


The Great Strategy Swap – Selling "Old Auto" to Buy "Future Light"


Not a Bubble, But the "Industrial Revolution 4.0" Engine
Popular Narratives


MicroVision will explode future revenue by 380.37% with a vision towards success


NVDA: Expanding AI Demand Will Drive Major Data Center Investments Through 2026


