- Sweden
- /
- Life Sciences
- /
- OM:MCAP
MedCap AB (publ)'s (STO:MCAP) Earnings Haven't Escaped The Attention Of Investors


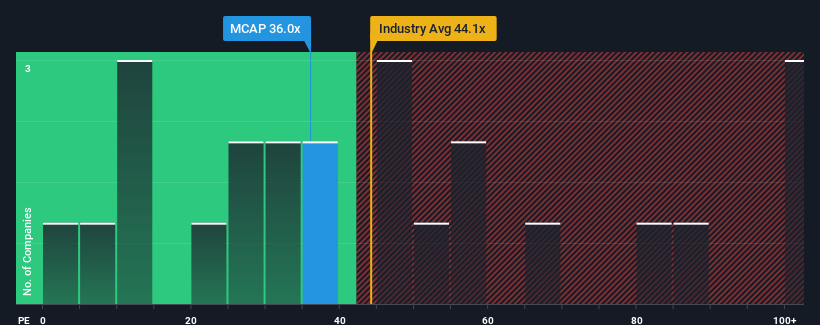
With a price-to-earnings (or "P/E") ratio of 36x MedCap AB (publ) (STO:MCAP) may be sending very bearish signals at the moment, given that almost half of all companies in Sweden have P/E ratios under 23x and even P/E's lower than 15x are not unusual. Although, it's not wise to just take the P/E at face value as there may be an explanation why it's so lofty.
Recent times have been quite advantageous for MedCap as its earnings have been rising very briskly. The P/E is probably high because investors think this strong earnings growth will be enough to outperform the broader market in the near future. If not, then existing shareholders might be a little nervous about the viability of the share price.
View our latest analysis for MedCap
What Are Growth Metrics Telling Us About The High P/E?
The only time you'd be truly comfortable seeing a P/E as steep as MedCap's is when the company's growth is on track to outshine the market decidedly.
Taking a look back first, we see that the company grew earnings per share by an impressive 44% last year. Pleasingly, EPS has also lifted 234% in aggregate from three years ago, thanks to the last 12 months of growth. Accordingly, shareholders would have probably welcomed those medium-term rates of earnings growth.
Comparing that to the market, which is only predicted to deliver 28% growth in the next 12 months, the company's momentum is stronger based on recent medium-term annualised earnings results.
In light of this, it's understandable that MedCap's P/E sits above the majority of other companies. It seems most investors are expecting this strong growth to continue and are willing to pay more for the stock.
The Bottom Line On MedCap's P/E
We'd say the price-to-earnings ratio's power isn't primarily as a valuation instrument but rather to gauge current investor sentiment and future expectations.
As we suspected, our examination of MedCap revealed its three-year earnings trends are contributing to its high P/E, given they look better than current market expectations. At this stage investors feel the potential for a deterioration in earnings isn't great enough to justify a lower P/E ratio. Unless the recent medium-term conditions change, they will continue to provide strong support to the share price.
A lot of potential risks can sit within a company's balance sheet. Our free balance sheet analysis for MedCap with six simple checks will allow you to discover any risks that could be an issue.
Of course, you might find a fantastic investment by looking at a few good candidates. So take a peek at this free list of companies with a strong growth track record, trading on a low P/E.
If you're looking to trade MedCap, open an account with the lowest-cost platform trusted by professionals, Interactive Brokers.
With clients in over 200 countries and territories, and access to 160 markets, IBKR lets you trade stocks, options, futures, forex, bonds and funds from a single integrated account.
Enjoy no hidden fees, no account minimums, and FX conversion rates as low as 0.03%, far better than what most brokers offer.
Sponsored ContentNew: Manage All Your Stock Portfolios in One Place
We've created the ultimate portfolio companion for stock investors, and it's free.
• Connect an unlimited number of Portfolios and see your total in one currency
• Be alerted to new Warning Signs or Risks via email or mobile
• Track the Fair Value of your stocks
Have feedback on this article? Concerned about the content? Get in touch with us directly. Alternatively, email editorial-team (at) simplywallst.com.
This article by Simply Wall St is general in nature. We provide commentary based on historical data and analyst forecasts only using an unbiased methodology and our articles are not intended to be financial advice. It does not constitute a recommendation to buy or sell any stock, and does not take account of your objectives, or your financial situation. We aim to bring you long-term focused analysis driven by fundamental data. Note that our analysis may not factor in the latest price-sensitive company announcements or qualitative material. Simply Wall St has no position in any stocks mentioned.
About OM:MCAP
MedCap
A private equity firm specializing in investments in secondary direct, later stage, industry consolidation, add-on acquisitions, growth capital, middle market, mature, turnarounds, buyout.
Flawless balance sheet and good value.

