Here's Why We're Not Too Worried About LIDDS' (STO:LIDDS) Cash Burn Situation
There's no doubt that money can be made by owning shares of unprofitable businesses. For example, biotech and mining exploration companies often lose money for years before finding success with a new treatment or mineral discovery. But while history lauds those rare successes, those that fail are often forgotten; who remembers Pets.com?
So, the natural question for LIDDS (STO:LIDDS) shareholders is whether they should be concerned by its rate of cash burn. In this article, we define cash burn as its annual (negative) free cash flow, which is the amount of money a company spends each year to fund its growth. The first step is to compare its cash burn with its cash reserves, to give us its 'cash runway'.
Check out our latest analysis for LIDDS
When Might LIDDS Run Out Of Money?
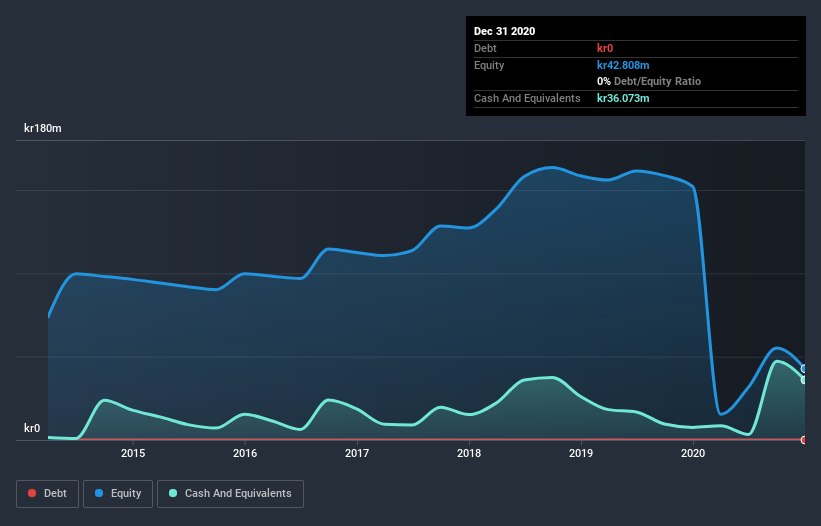
You can calculate a company's cash runway by dividing the amount of cash it has by the rate at which it is spending that cash. In December 2020, LIDDS had kr36m in cash, and was debt-free. Importantly, its cash burn was kr31m over the trailing twelve months. Therefore, from December 2020 it had roughly 14 months of cash runway. That's not too bad, but it's fair to say the end of the cash runway is in sight, unless cash burn reduces drastically. The image below shows how its cash balance has been changing over the last few years.

How Is LIDDS' Cash Burn Changing Over Time?
In our view, LIDDS doesn't yet produce significant amounts of operating revenue, since it reported just kr345k in the last twelve months. Therefore, for the purposes of this analysis we'll focus on how the cash burn is tracking. As it happens, the company's cash burn reduced by 13% over the last year, which suggests that management are maintaining a fairly steady rate of business development, albeit with a slight decrease in spending. LIDDS makes us a little nervous due to its lack of substantial operating revenue. So we'd generally prefer stocks from this list of stocks that have analysts forecasting growth.
How Easily Can LIDDS Raise Cash?
While LIDDS is showing a solid reduction in its cash burn, it's still worth considering how easily it could raise more cash, even just to fuel faster growth. Companies can raise capital through either debt or equity. Many companies end up issuing new shares to fund future growth. By looking at a company's cash burn relative to its market capitalisation, we gain insight on how much shareholders would be diluted if the company needed to raise enough cash to cover another year's cash burn.
LIDDS has a market capitalisation of kr475m and burnt through kr31m last year, which is 6.6% of the company's market value. That's a low proportion, so we figure the company would be able to raise more cash to fund growth, with a little dilution, or even to simply borrow some money.
Is LIDDS' Cash Burn A Worry?
LIDDS appears to be in pretty good health when it comes to its cash burn situation. Not only was its cash burn reduction quite good, but its cash burn relative to its market cap was a real positive. Cash burning companies are always on the riskier side of things, but after considering all of the factors discussed in this short piece, we're not too worried about its rate of cash burn. On another note, we conducted an in-depth investigation of the company, and identified 4 warning signs for LIDDS (2 make us uncomfortable!) that you should be aware of before investing here.
Of course LIDDS may not be the best stock to buy. So you may wish to see this free collection of companies boasting high return on equity, or this list of stocks that insiders are buying.
If you’re looking to trade LIDDS, open an account with the lowest-cost* platform trusted by professionals, Interactive Brokers. Their clients from over 200 countries and territories trade stocks, options, futures, forex, bonds and funds worldwide from a single integrated account. Promoted
New: AI Stock Screener & Alerts
Our new AI Stock Screener scans the market every day to uncover opportunities.
• Dividend Powerhouses (3%+ Yield)
• Undervalued Small Caps with Insider Buying
• High growth Tech and AI Companies
Or build your own from over 50 metrics.
This article by Simply Wall St is general in nature. It does not constitute a recommendation to buy or sell any stock, and does not take account of your objectives, or your financial situation. We aim to bring you long-term focused analysis driven by fundamental data. Note that our analysis may not factor in the latest price-sensitive company announcements or qualitative material. Simply Wall St has no position in any stocks mentioned.
*Interactive Brokers Rated Lowest Cost Broker by StockBrokers.com Annual Online Review 2020
Have feedback on this article? Concerned about the content? Get in touch with us directly. Alternatively, email editorial-team (at) simplywallst.com.
About OM:LIDDS
LIDDS
A drug delivery company, develops pharmaceutical products based on its NanoZolid proprietary technology for the treatment of cancer and other diseases in Sweden.
Adequate balance sheet with slight risk.
Market Insights
Community Narratives


Recently Updated Narratives

Constellation Energy Dividends and Growth

CoreWeave's Revenue Expected to Rocket 77.88% in 5-Year Forecast

Bisalloy Steel Group will shine with a projected profit margin increase of 12.8%
Popular Narratives


MicroVision will explode future revenue by 380.37% with a vision towards success


NVDA: Expanding AI Demand Will Drive Major Data Center Investments Through 2026


