- Sweden
- /
- Entertainment
- /
- OM:EMBRAC B
Investors in Embracer Group (STO:EMBRAC B) from three years ago are still down 60%, even after 3.4% gain this past week

If you are building a properly diversified stock portfolio, the chances are some of your picks will perform badly. But the last three years have been particularly tough on longer term Embracer Group AB (publ) (STO:EMBRAC B) shareholders. So they might be feeling emotional about the 78% share price collapse, in that time. The falls have accelerated recently, with the share price down 46% in the last three months.
Although the past week has been more reassuring for shareholders, they're still in the red over the last three years, so let's see if the underlying business has been responsible for the decline.
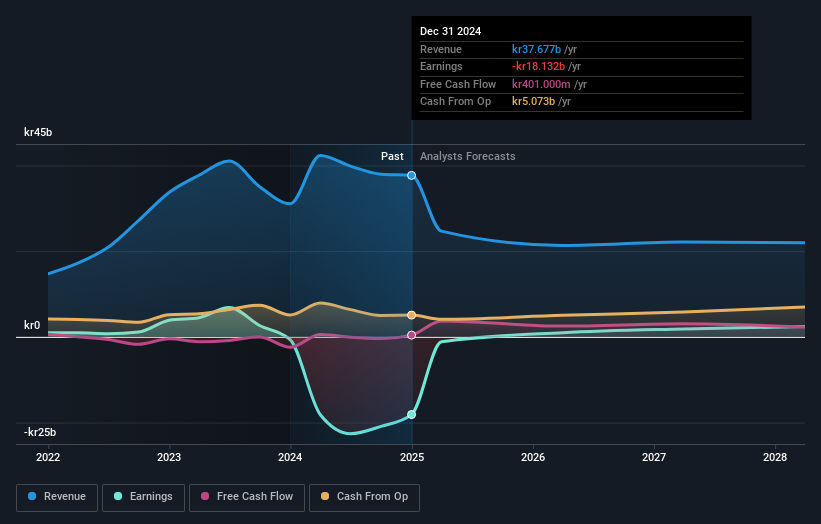
Embracer Group isn't currently profitable, so most analysts would look to revenue growth to get an idea of how fast the underlying business is growing. Generally speaking, companies without profits are expected to grow revenue every year, and at a good clip. As you can imagine, fast revenue growth, when maintained, often leads to fast profit growth.
In the last three years, Embracer Group saw its revenue grow by 24% per year, compound. That is faster than most pre-profit companies. So why has the share priced crashed 21% per year, in the same time? The share price makes us wonder if there is an issue with profitability. Sometimes fast revenue growth doesn't lead to profits. If the company is low on cash, it may have to raise capital soon.
The graphic below depicts how earnings and revenue have changed over time (unveil the exact values by clicking on the image).

We like that insiders have been buying shares in the last twelve months. Having said that, most people consider earnings and revenue growth trends to be a more meaningful guide to the business. So we recommend checking out this free report showing consensus forecasts
What About The Total Shareholder Return (TSR)?
We'd be remiss not to mention the difference between Embracer Group's total shareholder return (TSR) and its share price return. Arguably the TSR is a more complete return calculation because it accounts for the value of dividends (as if they were reinvested), along with the hypothetical value of any discounted capital that have been offered to shareholders. Its history of dividend payouts mean that Embracer Group's TSR, which was a 60% drop over the last 3 years, was not as bad as the share price return.
A Different Perspective
It's good to see that Embracer Group has rewarded shareholders with a total shareholder return of 30% in the last twelve months. There's no doubt those recent returns are much better than the TSR loss of 5% per year over five years. The long term loss makes us cautious, but the short term TSR gain certainly hints at a brighter future. I find it very interesting to look at share price over the long term as a proxy for business performance. But to truly gain insight, we need to consider other information, too. Case in point: We've spotted 1 warning sign for Embracer Group you should be aware of.
If you like to buy stocks alongside management, then you might just love this free list of companies. (Hint: most of them are flying under the radar).
Please note, the market returns quoted in this article reflect the market weighted average returns of stocks that currently trade on Swedish exchanges.
Valuation is complex, but we're here to simplify it.
Discover if Embracer Group might be undervalued or overvalued with our detailed analysis, featuring fair value estimates, potential risks, dividends, insider trades, and its financial condition.
Access Free AnalysisHave feedback on this article? Concerned about the content? Get in touch with us directly. Alternatively, email editorial-team (at) simplywallst.com.
This article by Simply Wall St is general in nature. We provide commentary based on historical data and analyst forecasts only using an unbiased methodology and our articles are not intended to be financial advice. It does not constitute a recommendation to buy or sell any stock, and does not take account of your objectives, or your financial situation. We aim to bring you long-term focused analysis driven by fundamental data. Note that our analysis may not factor in the latest price-sensitive company announcements or qualitative material. Simply Wall St has no position in any stocks mentioned.
About OM:EMBRAC B
Embracer Group
Develops and publishes PC, console, mobile, VR, and board games for the games market worldwide.
Flawless balance sheet and undervalued.
Similar Companies
Market Insights
Community Narratives


