
Advertisement

David Iben put it well when he said, 'Volatility is not a risk we care about. What we care about is avoiding the permanent loss of capital.' So it might be obvious that you need to consider debt, when you think about how risky any given stock is, because too much debt can sink a company. We note that Holmen AB (publ) (STO:HOLM B) does have debt on its balance sheet. But the more important question is: how much risk is that debt creating?
Why Does Debt Bring Risk?
Debt is a tool to help businesses grow, but if a business is incapable of paying off its lenders, then it exists at their mercy. Part and parcel of capitalism is the process of 'creative destruction' where failed businesses are mercilessly liquidated by their bankers. However, a more common (but still painful) scenario is that it has to raise new equity capital at a low price, thus permanently diluting shareholders. Of course, plenty of companies use debt to fund growth, without any negative consequences. The first thing to do when considering how much debt a business uses is to look at its cash and debt together.
View our latest analysis for Holmen
How Much Debt Does Holmen Carry?
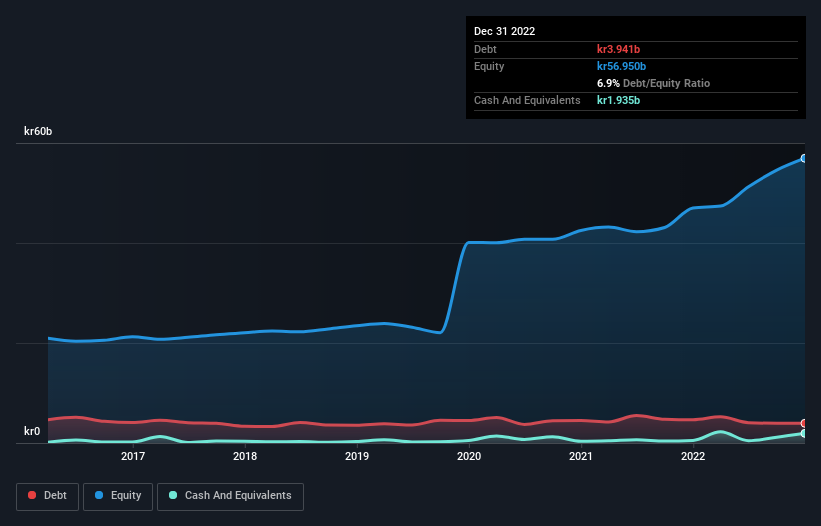
The image below, which you can click on for greater detail, shows that Holmen had debt of kr3.94b at the end of December 2022, a reduction from kr4.65b over a year. However, it does have kr1.94b in cash offsetting this, leading to net debt of about kr2.01b.
A Look At Holmen's Liabilities
According to the last reported balance sheet, Holmen had liabilities of kr7.49b due within 12 months, and liabilities of kr17.0b due beyond 12 months. Offsetting these obligations, it had cash of kr1.94b as well as receivables valued at kr9.94b due within 12 months. So its liabilities outweigh the sum of its cash and (near-term) receivables by kr12.6b.
Of course, Holmen has a market capitalization of kr66.9b, so these liabilities are probably manageable. But there are sufficient liabilities that we would certainly recommend shareholders continue to monitor the balance sheet, going forward.
We measure a company's debt load relative to its earnings power by looking at its net debt divided by its earnings before interest, tax, depreciation, and amortization (EBITDA) and by calculating how easily its earnings before interest and tax (EBIT) cover its interest expense (interest cover). Thus we consider debt relative to earnings both with and without depreciation and amortization expenses.
Holmen has a low net debt to EBITDA ratio of only 0.24. And its EBIT easily covers its interest expense, being 80.6 times the size. So we're pretty relaxed about its super-conservative use of debt. Better yet, Holmen grew its EBIT by 138% last year, which is an impressive improvement. If maintained that growth will make the debt even more manageable in the years ahead. The balance sheet is clearly the area to focus on when you are analysing debt. But ultimately the future profitability of the business will decide if Holmen can strengthen its balance sheet over time. So if you're focused on the future you can check out this free report showing analyst profit forecasts.
Finally, a company can only pay off debt with cold hard cash, not accounting profits. So the logical step is to look at the proportion of that EBIT that is matched by actual free cash flow. During the last three years, Holmen produced sturdy free cash flow equating to 58% of its EBIT, about what we'd expect. This cold hard cash means it can reduce its debt when it wants to.
Our View
Happily, Holmen's impressive interest cover implies it has the upper hand on its debt. And the good news does not stop there, as its EBIT growth rate also supports that impression! Zooming out, Holmen seems to use debt quite reasonably; and that gets the nod from us. After all, sensible leverage can boost returns on equity. There's no doubt that we learn most about debt from the balance sheet. However, not all investment risk resides within the balance sheet - far from it. For example, we've discovered 3 warning signs for Holmen (1 shouldn't be ignored!) that you should be aware of before investing here.
At the end of the day, it's often better to focus on companies that are free from net debt. You can access our special list of such companies (all with a track record of profit growth). It's free.
Valuation is complex, but we're here to simplify it.
Discover if Holmen might be undervalued or overvalued with our detailed analysis, featuring fair value estimates, potential risks, dividends, insider trades, and its financial condition.
Access Free AnalysisHave feedback on this article? Concerned about the content? Get in touch with us directly. Alternatively, email editorial-team (at) simplywallst.com.
This article by Simply Wall St is general in nature. We provide commentary based on historical data and analyst forecasts only using an unbiased methodology and our articles are not intended to be financial advice. It does not constitute a recommendation to buy or sell any stock, and does not take account of your objectives, or your financial situation. We aim to bring you long-term focused analysis driven by fundamental data. Note that our analysis may not factor in the latest price-sensitive company announcements or qualitative material. Simply Wall St has no position in any stocks mentioned.
About OM:HOLM B
Holmen
Engages in forest, paperboard, paper, wood products, and renewable energy businesses in Sweden and internationally.
Excellent balance sheet second-rate dividend payer.
Similar Companies
Market Insights


Advertisement
Community Narratives
Nike's Direct-to-Consumer Focus Will Drive Future Growth
Fair Value US$87.90|22.7% undervalued
UN
Community Contributor
Novo Nordisk will dominate GLP-1 market with Ozempic and Wegovy growth
Fair Value US$89.59|14.2% undervalued
BE
Community Contributor
Rheinmetall could get 20-25% of EU-NATO 3%-GDP defence spending
Fair Value €7.57k|82.8% undervalued
NO
Community Contributor