
Advertisement
- Sweden
- /
- Metals and Mining
- /
- OM:AUR
Auriant Mining AB (publ)'s (STO:AUR) Share Price Boosted 33% But Its Business Prospects Need A Lift Too
Auriant Mining AB (publ) (STO:AUR) shareholders have had their patience rewarded with a 33% share price jump in the last month. But the gains over the last month weren't enough to make shareholders whole, as the share price is still down 8.3% in the last twelve months.
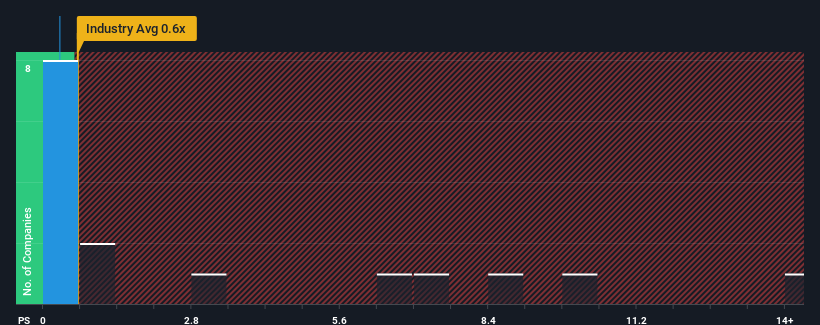
Although its price has surged higher, Auriant Mining may still be sending bullish signals at the moment with its price-to-sales (or "P/S") ratio of 0.3x, since almost half of all companies in the Metals and Mining industry in Sweden have P/S ratios greater than 0.9x and even P/S higher than 8x are not unusual. However, the P/S might be low for a reason and it requires further investigation to determine if it's justified.
See our latest analysis for Auriant Mining
What Does Auriant Mining's P/S Mean For Shareholders?
For example, consider that Auriant Mining's financial performance has been poor lately as its revenue has been in decline. It might be that many expect the disappointing revenue performance to continue or accelerate, which has repressed the P/S. If you like the company, you'd be hoping this isn't the case so that you could potentially pick up some stock while it's out of favour.
We don't have analyst forecasts, but you can see how recent trends are setting up the company for the future by checking out our free report on Auriant Mining's earnings, revenue and cash flow.Do Revenue Forecasts Match The Low P/S Ratio?
In order to justify its P/S ratio, Auriant Mining would need to produce sluggish growth that's trailing the industry.
Retrospectively, the last year delivered a frustrating 28% decrease to the company's top line. The last three years don't look nice either as the company has shrunk revenue by 27% in aggregate. Accordingly, shareholders would have felt downbeat about the medium-term rates of revenue growth.
This is in contrast to the rest of the industry, which is expected to decline by 4.6% over the next year, or less than the company's recent medium-term annualised revenue decline.
With this in consideration, it's no surprise that Auriant Mining's P/S falls short of its industry peers. Nonetheless, with revenue going quickly in reverse, it's not guaranteed that the P/S has found a floor yet. There's potential for the P/S to fall to even lower levels if the company doesn't improve its top-line growth, which would be difficult to do with the current industry outlook.
What We Can Learn From Auriant Mining's P/S?
The latest share price surge wasn't enough to lift Auriant Mining's P/S close to the industry median. It's argued the price-to-sales ratio is an inferior measure of value within certain industries, but it can be a powerful business sentiment indicator.
As we suspected, our examination of Auriant Mining revealed its sharp three-year contraction in revenue is contributing to its low P/S, given the industry is set to shrink less severely. At this stage investors feel the potential for an improvement in revenue isn't great enough to justify a higher P/S ratio. However, we're still cautious about the company's ability to prevent an acceleration of its recent medium-term course and resist even greater pain to its business from the broader industry turmoil. In the meantime, unless the company's relative performance improves, the share price will hit a barrier around these levels.
And what about other risks? Every company has them, and we've spotted 3 warning signs for Auriant Mining (of which 2 can't be ignored!) you should know about.
If you're unsure about the strength of Auriant Mining's business, why not explore our interactive list of stocks with solid business fundamentals for some other companies you may have missed.
New: Manage All Your Stock Portfolios in One Place
We've created the ultimate portfolio companion for stock investors, and it's free.
• Connect an unlimited number of Portfolios and see your total in one currency
• Be alerted to new Warning Signs or Risks via email or mobile
• Track the Fair Value of your stocks
Have feedback on this article? Concerned about the content? Get in touch with us directly. Alternatively, email editorial-team (at) simplywallst.com.
This article by Simply Wall St is general in nature. We provide commentary based on historical data and analyst forecasts only using an unbiased methodology and our articles are not intended to be financial advice. It does not constitute a recommendation to buy or sell any stock, and does not take account of your objectives, or your financial situation. We aim to bring you long-term focused analysis driven by fundamental data. Note that our analysis may not factor in the latest price-sensitive company announcements or qualitative material. Simply Wall St has no position in any stocks mentioned.
About OM:AUR
Auriant Mining
A junior mining company, engages in the exploration and production of gold in Russia.
Good value slight.
Market Insights

Advertisement
Community Narratives
100% Patient Improvement in trial puts this $16M Biotech on the radar
Fair Value US$5.30|69.8% undervalued
JO
Community Contributor
Exxon Mobil's 17.5% Upside Promises Industry-Leading Returns in Energy Transition
Fair Value US$132.00|15.0% undervalued
HE
Community Contributor
NHC Analysis: Quality at a Good Price. A Golden Opportunity?
Fair Value US$179.80|36.1% undervalued
DA
Community Contributor
Product Refresh And Global Expansion Will Empower Future Market Leadership
Fair Value US$202.60|21.1% undervalued
AN
Based on Analyst Price Targets