- Sweden
- /
- Household Products
- /
- OM:ESGR B
We Think ES Energy Save Holding (STO:ESGR B) Has A Fair Chunk Of Debt


Legendary fund manager Li Lu (who Charlie Munger backed) once said, 'The biggest investment risk is not the volatility of prices, but whether you will suffer a permanent loss of capital.' So it might be obvious that you need to consider debt, when you think about how risky any given stock is, because too much debt can sink a company. We note that ES Energy Save Holding AB (publ) (STO:ESGR B) does have debt on its balance sheet. But the real question is whether this debt is making the company risky.
When Is Debt A Problem?
Debt assists a business until the business has trouble paying it off, either with new capital or with free cash flow. Ultimately, if the company can't fulfill its legal obligations to repay debt, shareholders could walk away with nothing. However, a more frequent (but still costly) occurrence is where a company must issue shares at bargain-basement prices, permanently diluting shareholders, just to shore up its balance sheet. Of course, the upside of debt is that it often represents cheap capital, especially when it replaces dilution in a company with the ability to reinvest at high rates of return. The first thing to do when considering how much debt a business uses is to look at its cash and debt together.
See our latest analysis for ES Energy Save Holding
How Much Debt Does ES Energy Save Holding Carry?
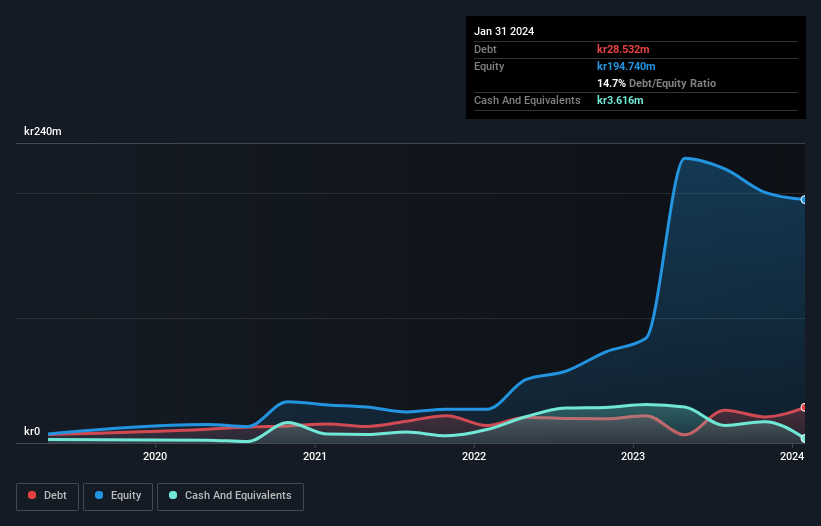
As you can see below, at the end of January 2024, ES Energy Save Holding had kr28.5m of debt, up from kr21.9m a year ago. Click the image for more detail. However, it also had kr3.62m in cash, and so its net debt is kr24.9m.
How Healthy Is ES Energy Save Holding's Balance Sheet?
We can see from the most recent balance sheet that ES Energy Save Holding had liabilities of kr77.0m falling due within a year, and liabilities of kr13.3m due beyond that. On the other hand, it had cash of kr3.62m and kr22.4m worth of receivables due within a year. So its liabilities total kr64.3m more than the combination of its cash and short-term receivables.
ES Energy Save Holding has a market capitalization of kr235.8m, so it could very likely raise cash to ameliorate its balance sheet, if the need arose. However, it is still worthwhile taking a close look at its ability to pay off debt. The balance sheet is clearly the area to focus on when you are analysing debt. But ultimately the future profitability of the business will decide if ES Energy Save Holding can strengthen its balance sheet over time. So if you want to see what the professionals think, you might find this free report on analyst profit forecasts to be interesting.
Over 12 months, ES Energy Save Holding made a loss at the EBIT level, and saw its revenue drop to kr170m, which is a fall of 41%. That makes us nervous, to say the least.
Caveat Emptor
Not only did ES Energy Save Holding's revenue slip over the last twelve months, but it also produced negative earnings before interest and tax (EBIT). Indeed, it lost kr24m at the EBIT level. When we look at that and recall the liabilities on its balance sheet, relative to cash, it seems unwise to us for the company to have any debt. So we think its balance sheet is a little strained, though not beyond repair. Another cause for caution is that is bled kr89m in negative free cash flow over the last twelve months. So in short it's a really risky stock. There's no doubt that we learn most about debt from the balance sheet. But ultimately, every company can contain risks that exist outside of the balance sheet. For instance, we've identified 1 warning sign for ES Energy Save Holding that you should be aware of.
Of course, if you're the type of investor who prefers buying stocks without the burden of debt, then don't hesitate to discover our exclusive list of net cash growth stocks, today.
Valuation is complex, but we're here to simplify it.
Discover if ES Energy Save Holding might be undervalued or overvalued with our detailed analysis, featuring fair value estimates, potential risks, dividends, insider trades, and its financial condition.
Access Free AnalysisHave feedback on this article? Concerned about the content? Get in touch with us directly. Alternatively, email editorial-team (at) simplywallst.com.
This article by Simply Wall St is general in nature. We provide commentary based on historical data and analyst forecasts only using an unbiased methodology and our articles are not intended to be financial advice. It does not constitute a recommendation to buy or sell any stock, and does not take account of your objectives, or your financial situation. We aim to bring you long-term focused analysis driven by fundamental data. Note that our analysis may not factor in the latest price-sensitive company announcements or qualitative material. Simply Wall St has no position in any stocks mentioned.
About OM:ESGR B
Flawless balance sheet with high growth potential.
Market Insights

Community Narratives


