
Advertisement

David Iben put it well when he said, 'Volatility is not a risk we care about. What we care about is avoiding the permanent loss of capital.' It's only natural to consider a company's balance sheet when you examine how risky it is, since debt is often involved when a business collapses. Importantly, Agtira AB (STO:AGTIRA B) does carry debt. But is this debt a concern to shareholders?
Why Does Debt Bring Risk?
Debt is a tool to help businesses grow, but if a business is incapable of paying off its lenders, then it exists at their mercy. Ultimately, if the company can't fulfill its legal obligations to repay debt, shareholders could walk away with nothing. While that is not too common, we often do see indebted companies permanently diluting shareholders because lenders force them to raise capital at a distressed price. Of course, plenty of companies use debt to fund growth, without any negative consequences. When we examine debt levels, we first consider both cash and debt levels, together.
Check out our latest analysis for Agtira
How Much Debt Does Agtira Carry?
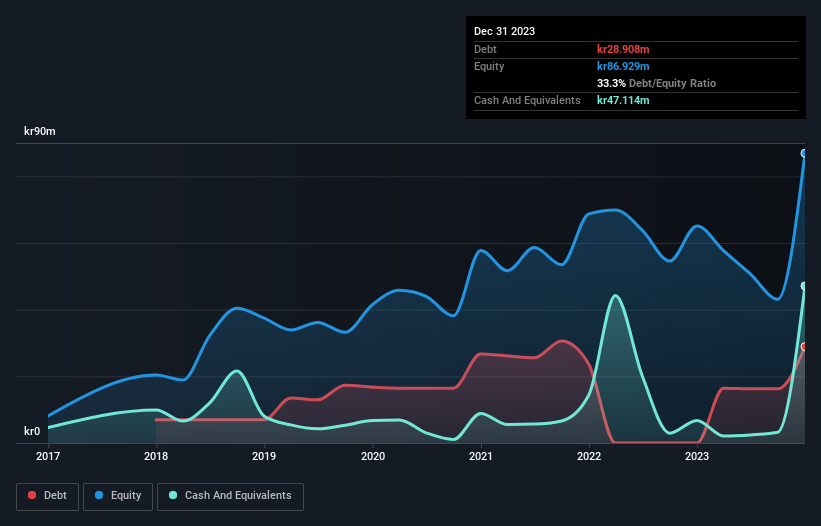
As you can see below, at the end of December 2023, Agtira had kr28.9m of debt, up from none a year ago. Click the image for more detail. However, its balance sheet shows it holds kr47.1m in cash, so it actually has kr18.2m net cash.
How Healthy Is Agtira's Balance Sheet?
Zooming in on the latest balance sheet data, we can see that Agtira had liabilities of kr23.4m due within 12 months and liabilities of kr28.3m due beyond that. On the other hand, it had cash of kr47.1m and kr6.46m worth of receivables due within a year. So it actually has kr1.85m more liquid assets than total liabilities.
This state of affairs indicates that Agtira's balance sheet looks quite solid, as its total liabilities are just about equal to its liquid assets. So while it's hard to imagine that the kr111.0m company is struggling for cash, we still think it's worth monitoring its balance sheet. Succinctly put, Agtira boasts net cash, so it's fair to say it does not have a heavy debt load! When analysing debt levels, the balance sheet is the obvious place to start. But it is Agtira's earnings that will influence how the balance sheet holds up in the future. So if you're keen to discover more about its earnings, it might be worth checking out this graph of its long term earnings trend.
In the last year Agtira wasn't profitable at an EBIT level, but managed to grow its revenue by 11%, to kr38m. That rate of growth is a bit slow for our taste, but it takes all types to make a world.
So How Risky Is Agtira?
By their very nature companies that are losing money are more risky than those with a long history of profitability. And in the last year Agtira had an earnings before interest and tax (EBIT) loss, truth be told. Indeed, in that time it burnt through kr53m of cash and made a loss of kr36m. With only kr18.2m on the balance sheet, it would appear that its going to need to raise capital again soon. Overall, its balance sheet doesn't seem overly risky, at the moment, but we're always cautious until we see the positive free cash flow. When analysing debt levels, the balance sheet is the obvious place to start. However, not all investment risk resides within the balance sheet - far from it. We've identified 6 warning signs with Agtira (at least 4 which are potentially serious) , and understanding them should be part of your investment process.
At the end of the day, it's often better to focus on companies that are free from net debt. You can access our special list of such companies (all with a track record of profit growth). It's free.
New: Manage All Your Stock Portfolios in One Place
We've created the ultimate portfolio companion for stock investors, and it's free.
• Connect an unlimited number of Portfolios and see your total in one currency
• Be alerted to new Warning Signs or Risks via email or mobile
• Track the Fair Value of your stocks
Have feedback on this article? Concerned about the content? Get in touch with us directly. Alternatively, email editorial-team (at) simplywallst.com.
This article by Simply Wall St is general in nature. We provide commentary based on historical data and analyst forecasts only using an unbiased methodology and our articles are not intended to be financial advice. It does not constitute a recommendation to buy or sell any stock, and does not take account of your objectives, or your financial situation. We aim to bring you long-term focused analysis driven by fundamental data. Note that our analysis may not factor in the latest price-sensitive company announcements or qualitative material. Simply Wall St has no position in any stocks mentioned.
About OM:AGTIRA B
Slight with imperfect balance sheet.
Market Insights


Advertisement
Community Narratives
Nike's Direct-to-Consumer Focus Will Drive Future Growth
Fair Value US$87.90|18.2% undervalued
UN
Community Contributor
Novo Nordisk will dominate GLP-1 market with Ozempic and Wegovy growth
Fair Value US$89.59|12.1% undervalued
BE
Community Contributor
Rheinmetall could get 20-25% of EU-NATO 3%-GDP defence spending
Fair Value €7.57k|82.4% undervalued
NO
Community Contributor