

Key Insights
- AAK AB (publ.)'s estimated fair value is kr254 based on 2 Stage Free Cash Flow to Equity
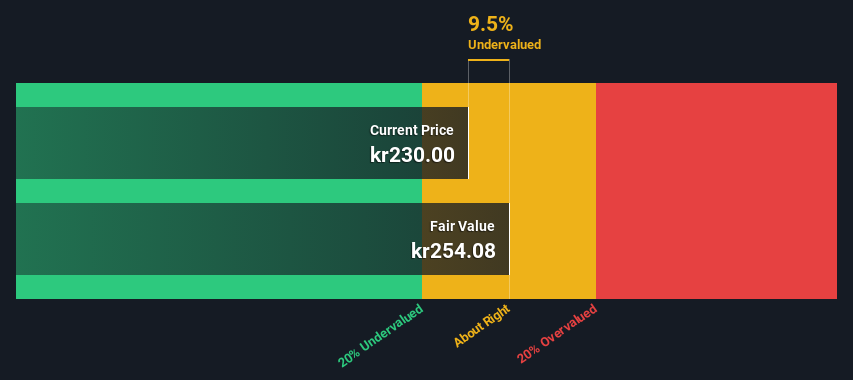
- AAK AB (publ.)'s kr230 share price indicates it is trading at similar levels as its fair value estimate
- Our fair value estimate is similar to AAK AB (publ.)'s analyst price target of kr256
Today we will run through one way of estimating the intrinsic value of AAK AB (publ.) (STO:AAK) by taking the expected future cash flows and discounting them to their present value. We will take advantage of the Discounted Cash Flow (DCF) model for this purpose. There's really not all that much to it, even though it might appear quite complex.
Remember though, that there are many ways to estimate a company's value, and a DCF is just one method. If you want to learn more about discounted cash flow, the rationale behind this calculation can be read in detail in the Simply Wall St analysis model.
View our latest analysis for AAK AB (publ.)
Crunching The Numbers
We're using the 2-stage growth model, which simply means we take in account two stages of company's growth. In the initial period the company may have a higher growth rate and the second stage is usually assumed to have a stable growth rate. To start off with, we need to estimate the next ten years of cash flows. Where possible we use analyst estimates, but when these aren't available we extrapolate the previous free cash flow (FCF) from the last estimate or reported value. We assume companies with shrinking free cash flow will slow their rate of shrinkage, and that companies with growing free cash flow will see their growth rate slow, over this period. We do this to reflect that growth tends to slow more in the early years than it does in later years.
Generally we assume that a dollar today is more valuable than a dollar in the future, and so the sum of these future cash flows is then discounted to today's value:
10-year free cash flow (FCF) forecast
| 2024 | 2025 | 2026 | 2027 | 2028 | 2029 | 2030 | 2031 | 2032 | 2033 | |
| Levered FCF (SEK, Millions) | kr2.85b | kr2.76b | kr3.12b | kr2.56b | kr2.54b | kr2.53b | kr2.53b | kr2.53b | kr2.54b | kr2.56b |
| Growth Rate Estimate Source | Analyst x5 | Analyst x5 | Analyst x4 | Analyst x1 | Est @ -0.96% | Est @ -0.41% | Est @ -0.02% | Est @ 0.25% | Est @ 0.44% | Est @ 0.57% |
| Present Value (SEK, Millions) Discounted @ 4.6% | kr2.7k | kr2.5k | kr2.7k | kr2.1k | kr2.0k | kr1.9k | kr1.8k | kr1.8k | kr1.7k | kr1.6k |
("Est" = FCF growth rate estimated by Simply Wall St)
Present Value of 10-year Cash Flow (PVCF) = kr21b
The second stage is also known as Terminal Value, this is the business's cash flow after the first stage. The Gordon Growth formula is used to calculate Terminal Value at a future annual growth rate equal to the 5-year average of the 10-year government bond yield of 0.9%. We discount the terminal cash flows to today's value at a cost of equity of 4.6%.
Terminal Value (TV)= FCF2033 × (1 + g) ÷ (r – g) = kr2.6b× (1 + 0.9%) ÷ (4.6%– 0.9%) = kr70b
Present Value of Terminal Value (PVTV)= TV / (1 + r)10= kr70b÷ ( 1 + 4.6%)10= kr45b
The total value, or equity value, is then the sum of the present value of the future cash flows, which in this case is kr66b. To get the intrinsic value per share, we divide this by the total number of shares outstanding. Compared to the current share price of kr230, the company appears about fair value at a 9.5% discount to where the stock price trades currently. Valuations are imprecise instruments though, rather like a telescope - move a few degrees and end up in a different galaxy. Do keep this in mind.
The Assumptions
The calculation above is very dependent on two assumptions. The first is the discount rate and the other is the cash flows. If you don't agree with these result, have a go at the calculation yourself and play with the assumptions. The DCF also does not consider the possible cyclicality of an industry, or a company's future capital requirements, so it does not give a full picture of a company's potential performance. Given that we are looking at AAK AB (publ.) as potential shareholders, the cost of equity is used as the discount rate, rather than the cost of capital (or weighted average cost of capital, WACC) which accounts for debt. In this calculation we've used 4.6%, which is based on a levered beta of 0.800. Beta is a measure of a stock's volatility, compared to the market as a whole. We get our beta from the industry average beta of globally comparable companies, with an imposed limit between 0.8 and 2.0, which is a reasonable range for a stable business.
SWOT Analysis for AAK AB (publ.)
- Earnings growth over the past year exceeded the industry.
- Debt is not viewed as a risk.
- Dividends are covered by earnings and cash flows.
- Dividend is low compared to the top 25% of dividend payers in the Food market.
- Annual revenue is forecast to grow faster than the Swedish market.
- Current share price is below our estimate of fair value.
- Annual earnings are forecast to grow slower than the Swedish market.
Moving On:
Although the valuation of a company is important, it ideally won't be the sole piece of analysis you scrutinize for a company. DCF models are not the be-all and end-all of investment valuation. Rather it should be seen as a guide to "what assumptions need to be true for this stock to be under/overvalued?" For instance, if the terminal value growth rate is adjusted slightly, it can dramatically alter the overall result. For AAK AB (publ.), there are three fundamental elements you should consider:
- Financial Health: Does AAK have a healthy balance sheet? Take a look at our free balance sheet analysis with six simple checks on key factors like leverage and risk.
- Management:Have insiders been ramping up their shares to take advantage of the market's sentiment for AAK's future outlook? Check out our management and board analysis with insights on CEO compensation and governance factors.
- Other High Quality Alternatives: Do you like a good all-rounder? Explore our interactive list of high quality stocks to get an idea of what else is out there you may be missing!
PS. The Simply Wall St app conducts a discounted cash flow valuation for every stock on the OM every day. If you want to find the calculation for other stocks just search here.
If you're looking to trade AAK AB (publ.), open an account with the lowest-cost platform trusted by professionals, Interactive Brokers.
With clients in over 200 countries and territories, and access to 160 markets, IBKR lets you trade stocks, options, futures, forex, bonds and funds from a single integrated account.
Enjoy no hidden fees, no account minimums, and FX conversion rates as low as 0.03%, far better than what most brokers offer.
Sponsored ContentNew: Manage All Your Stock Portfolios in One Place
We've created the ultimate portfolio companion for stock investors, and it's free.
• Connect an unlimited number of Portfolios and see your total in one currency
• Be alerted to new Warning Signs or Risks via email or mobile
• Track the Fair Value of your stocks
Have feedback on this article? Concerned about the content? Get in touch with us directly. Alternatively, email editorial-team (at) simplywallst.com.
This article by Simply Wall St is general in nature. We provide commentary based on historical data and analyst forecasts only using an unbiased methodology and our articles are not intended to be financial advice. It does not constitute a recommendation to buy or sell any stock, and does not take account of your objectives, or your financial situation. We aim to bring you long-term focused analysis driven by fundamental data. Note that our analysis may not factor in the latest price-sensitive company announcements or qualitative material. Simply Wall St has no position in any stocks mentioned.
About OM:AAK
AAK AB (publ.)
Develops and sells plant-based oils and fats in Sweden and internationally.
Flawless balance sheet with proven track record and pays a dividend.

