Advertisement
- Netherlands
- /
- Logistics
- /
- ENXTAM:FERGR
Uncovering Three European Hidden Gems with Strong Potential

Simply Wall St
Reviewed by Simply Wall St

As the pan-European STOXX Europe 600 Index recently climbed 1.32% amid easing trade tensions and promises of economic stimulus, the European market remains a fertile ground for uncovering hidden investment opportunities. In this environment, identifying stocks with strong fundamentals and growth potential can be particularly rewarding, as these companies may benefit from favorable economic conditions and investor sentiment.
Top 10 Undiscovered Gems With Strong Fundamentals In Europe
| Name | Debt To Equity | Revenue Growth | Earnings Growth | Health Rating |
|---|---|---|---|---|
| va-Q-tec | 43.54% | 9.84% | -34.33% | ★★★★★★ |
| Flügger group | 20.98% | 3.24% | -29.82% | ★★★★★☆ |
| Caisse Regionale de Credit Agricole Mutuel Toulouse 31 | 19.46% | 0.47% | 7.14% | ★★★★★☆ |
| Decora | 18.47% | 11.59% | 10.86% | ★★★★★☆ |
| Zespól Elektrocieplowni Wroclawskich KOGENERACJA | 14.04% | 21.73% | 17.76% | ★★★★★☆ |
| Alantra Partners | 3.79% | -3.99% | -23.83% | ★★★★★☆ |
| Viohalco | 93.48% | 11.98% | 14.19% | ★★★★☆☆ |
| Evergent Investments | 5.39% | 9.41% | 21.17% | ★★★★☆☆ |
| Darwin | 3.03% | 84.88% | 5.63% | ★★★★☆☆ |
| Practic | 5.21% | 4.49% | 7.23% | ★★★★☆☆ |
Underneath we present a selection of stocks filtered out by our screen.
Ferrari Group (ENXTAM:FERGR)
Simply Wall St Value Rating: ★★★★★☆
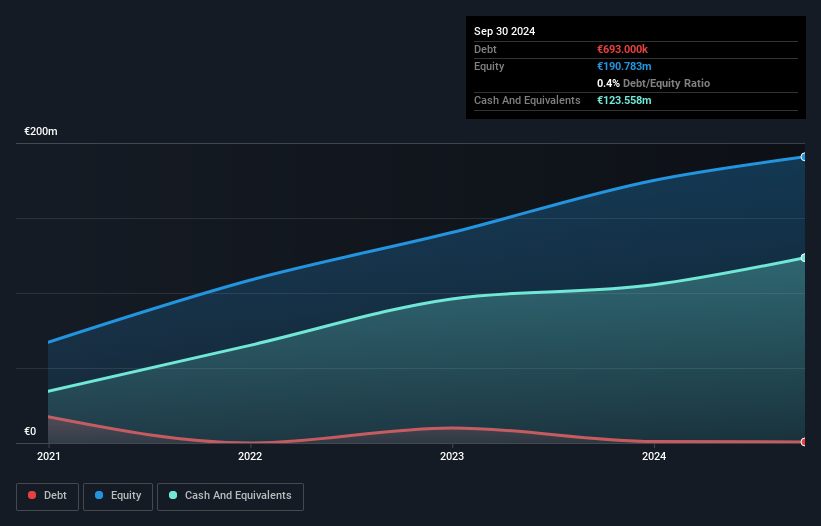
Overview: Ferrari Group PLC specializes in shipping, integrated logistics, and value-added services for jewelry and precious goods across Europe, Asia, North America, Brazil, and other international markets with a market cap of €835.40 million.
Operations: Ferrari Group generates revenue primarily from its business services, amounting to €348.76 million. The company's market capitalization stands at €835.40 million.
Ferrari Group, a player in the logistics industry, is making waves with its recent inclusion in the Netherlands ASCX AMS Small Cap Index and S&P Global BMI Index. With earnings growth of 4.9% last year, it outpaced the industry's -2.9%. Its financial health appears robust; it has more cash than total debt and trades at 46.3% below estimated fair value. The company seems to manage interest payments effectively while maintaining high-quality earnings. Looking ahead, a forecasted annual growth rate of 6.75% suggests potential for continued success amidst market volatility.
Byggmax Group (OM:BMAX)
Simply Wall St Value Rating: ★★★★☆☆
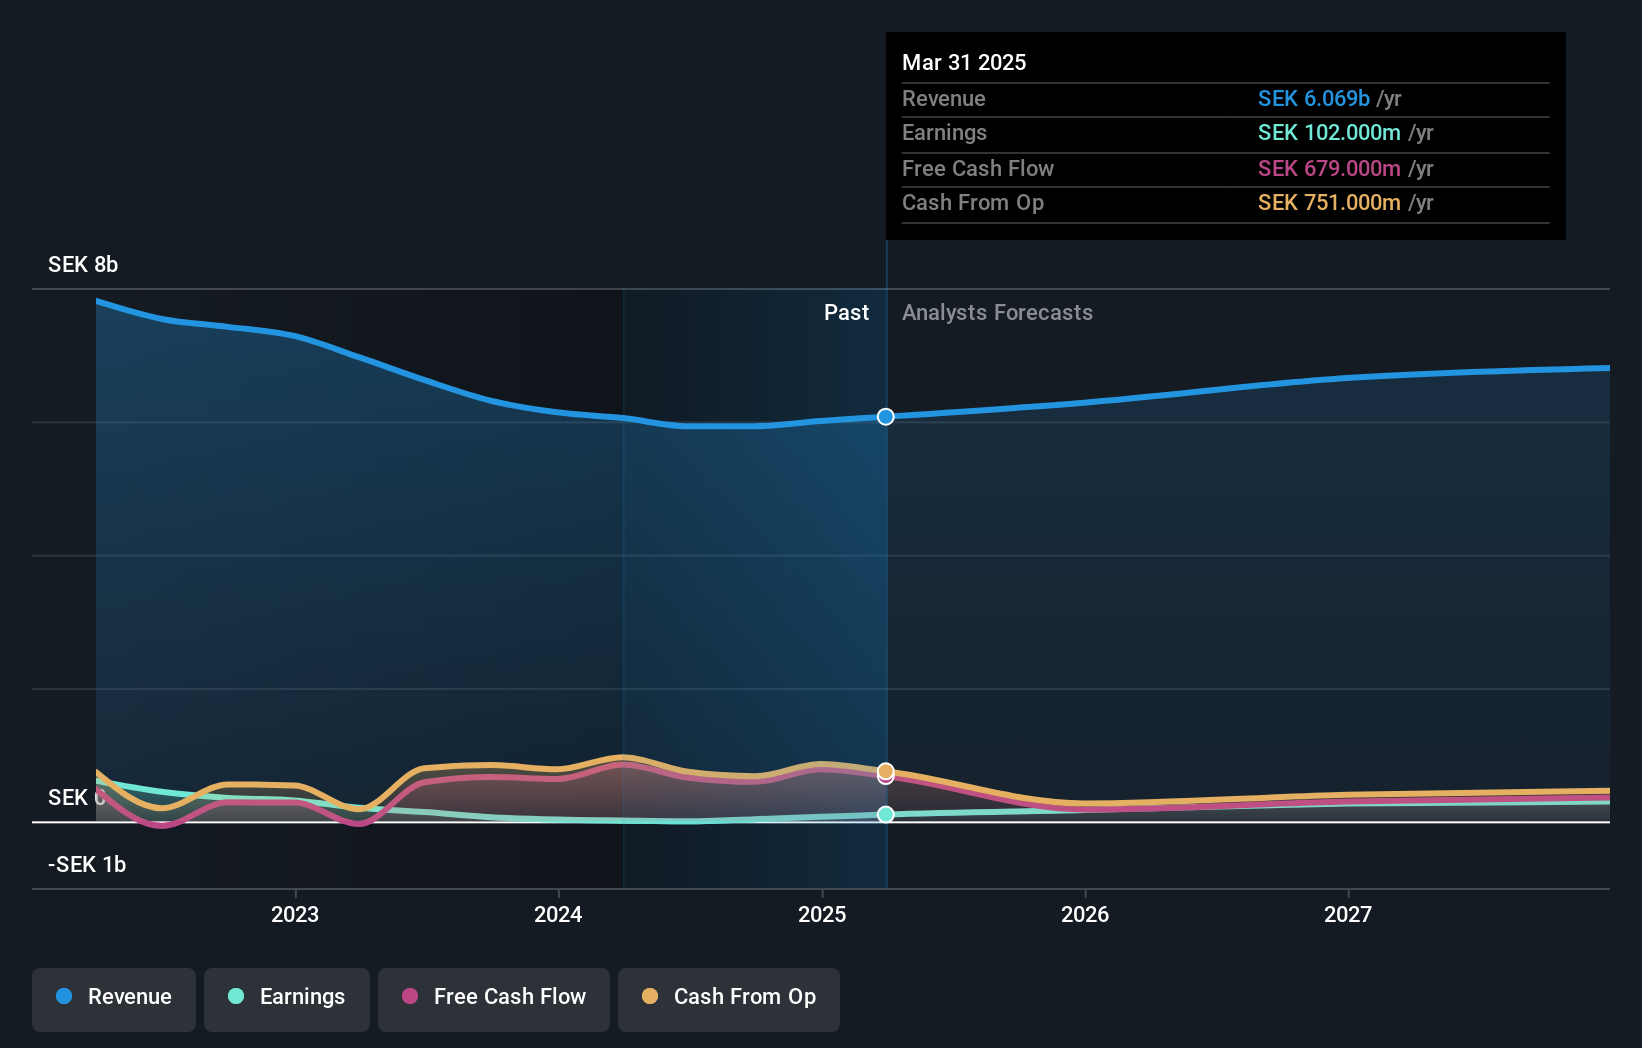
Overview: Byggmax Group AB (publ) is a company that provides building materials and related products for DIY projects across Sweden, Norway, and internationally, with a market cap of approximately SEK3.04 billion.
Operations: Byggmax Group's primary revenue stream is from the sale of building materials and related products, generating SEK6.07 billion. The company's net profit margin trends can provide insights into its profitability dynamics over time.
Byggmax Group, a modestly-sized player in the European retail sector, has demonstrated impressive financial resilience with a 750% earnings surge over the past year. This growth outpaces the industry average of -1.3%, highlighting its robust performance. The company's debt to equity ratio has improved significantly from 78.9% to 34.3% over five years, indicating effective debt management and financial stability. Despite reporting a net loss of SEK 112 million in Q1 2025, which is an improvement from SEK 147 million last year, Byggmax continues to trade at an attractive valuation—16.5% below its estimated fair value—offering potential for future appreciation as it enhances e-commerce logistics and expands product lines like modular houses and greenhouses.
Linc (OM:LINC)
Simply Wall St Value Rating: ★★★★★★
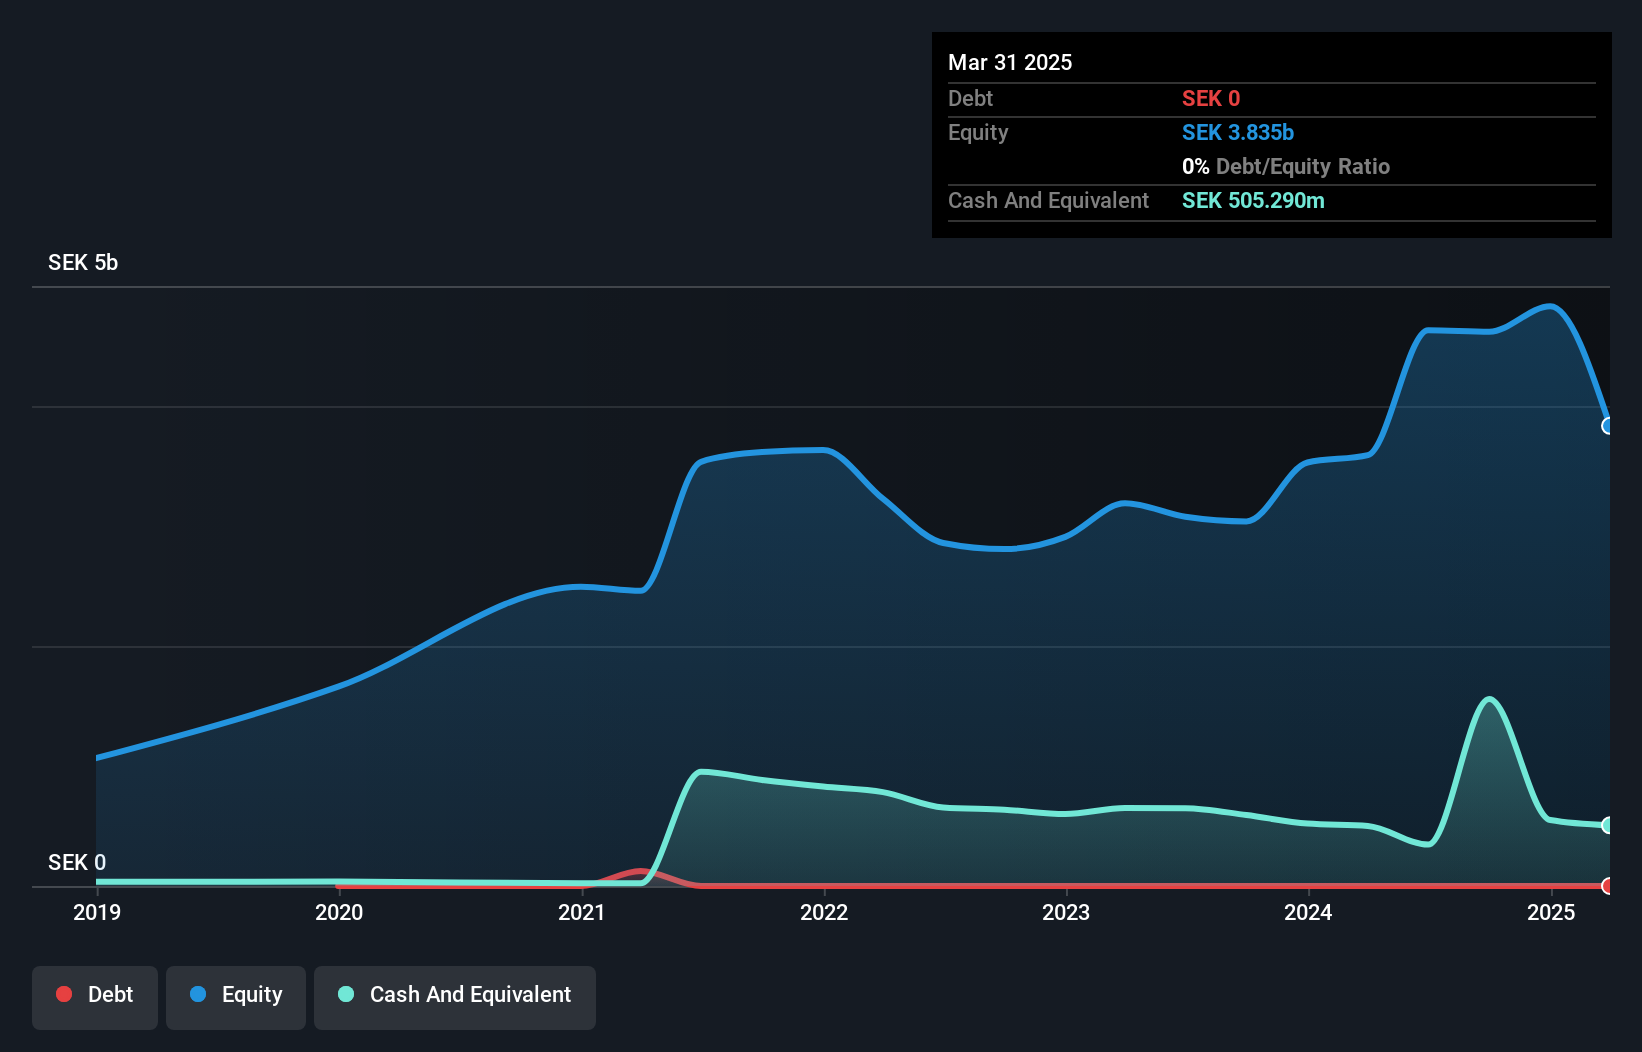
Overview: Linc AB is a private equity and venture capital firm focusing on early and mature stage investments in pharmaceutical, life-science, and med-tech companies, with a market cap of approximately SEK4.27 billion.
Operations: Linc AB generates revenue primarily from its listed holdings amounting to SEK297.02 million and unlisted holdings contributing SEK22.68 million.
Linc, a small player in the Swedish market, presents a mixed financial picture. Despite being debt-free and boasting high-quality past earnings, it faced significant challenges recently. The company's price-to-earnings ratio of 17.5x is more attractive than the Swedish market's 23.2x, yet its earnings growth was negative at -39.1% over the past year compared to an industry average of 15.1%. Recent insider selling raises concerns about confidence levels within the firm. In Q1 2025, Linc reported a substantial net loss of SEK 995.96 million against last year's profit of SEK 61.31 million, indicating potential volatility ahead.
- Get an in-depth perspective on Linc's performance by reading our health report here.
Explore historical data to track Linc's performance over time in our Past section.
Turning Ideas Into Actions
- Unlock our comprehensive list of 324 European Undiscovered Gems With Strong Fundamentals by clicking here.
- Already own these companies? Bring clarity to your investment decisions by linking up your portfolio with Simply Wall St, where you can monitor all the vital signs of your stocks effortlessly.
- Elevate your portfolio with Simply Wall St, the ultimate app for investors seeking global market coverage.
Interested In Other Possibilities?
- Explore high-performing small cap companies that haven't yet garnered significant analyst attention.
- Fuel your portfolio with companies showing strong growth potential, backed by optimistic outlooks both from analysts and management.
- Find companies with promising cash flow potential yet trading below their fair value.
This article by Simply Wall St is general in nature. We provide commentary based on historical data and analyst forecasts only using an unbiased methodology and our articles are not intended to be financial advice. It does not constitute a recommendation to buy or sell any stock, and does not take account of your objectives, or your financial situation. We aim to bring you long-term focused analysis driven by fundamental data. Note that our analysis may not factor in the latest price-sensitive company announcements or qualitative material. Simply Wall St has no position in any stocks mentioned.
New: AI Stock Screener & Alerts
Our new AI Stock Screener scans the market every day to uncover opportunities.
• Dividend Powerhouses (3%+ Yield)
• Undervalued Small Caps with Insider Buying
• High growth Tech and AI Companies
Or build your own from over 50 metrics.
Have feedback on this article? Concerned about the content? Get in touch with us directly. Alternatively, email editorial-team@simplywallst.com
About ENXTAM:FERGR
Ferrari Group
Provides shipping, integrated logistics, and value-added services for jewelry and precious goods in Europe, Asia, North America, Brazil, and internationally.
Solid track record with excellent balance sheet.
Similar Companies
Market Insights


Advertisement
Community Narratives
The Future of Drug Testing? Fingerprint Tech Shows Serious Promise
Fair Value US$2.98|38.6% undervalued
JO
Community Contributor
Suncorp’s Next Chapter: Insurance-Only and Ready to Grow
Fair Value AU$22.83|8.8% undervalued
RO
Community Contributor
Thyssenkrupp Nucera Will Achieve Double-Digit Profits by 2030 Boosted by Hydrogen Growth
Fair Value €14.40|31.6% undervalued
CH
Community Contributor
Tesla’s Nvidia Moment – The AI & Robotics Inflection Point
Fair Value US$384.84|18.0% undervalued
BL
Community Contributor