
Advertisement
- Sweden
- /
- Hospitality
- /
- OM:ATIC
Lacklustre Performance Is Driving Actic Group AB (publ)'s (STO:ATIC) 32% Price Drop
Actic Group AB (publ) (STO:ATIC) shares have retraced a considerable 32% in the last month, reversing a fair amount of their solid recent performance. Still, a bad month hasn't completely ruined the past year with the stock gaining 48%, which is great even in a bull market.
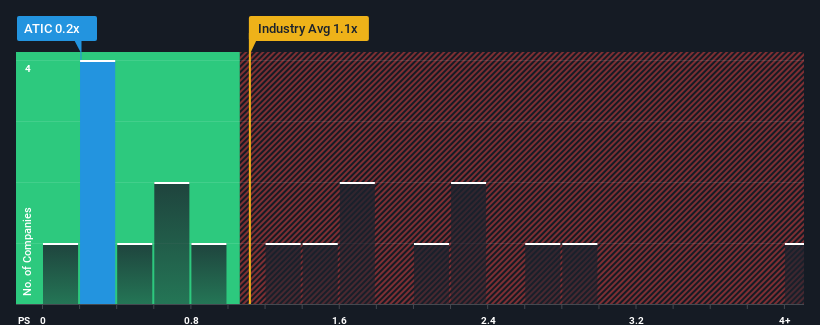
After such a large drop in price, Actic Group may be sending bullish signals at the moment with its price-to-sales (or "P/S") ratio of 0.2x, since almost half of all companies in the Hospitality industry in Sweden have P/S ratios greater than 0.8x and even P/S higher than 3x are not unusual. However, the P/S might be low for a reason and it requires further investigation to determine if it's justified.
See our latest analysis for Actic Group
What Does Actic Group's P/S Mean For Shareholders?
It looks like revenue growth has deserted Actic Group recently, which is not something to boast about. One possibility is that the P/S is low because investors think this benign revenue growth rate will likely underperform the broader industry in the near future. If you like the company, you'd be hoping this isn't the case so that you could potentially pick up some stock while it's out of favour.
Want the full picture on earnings, revenue and cash flow for the company? Then our free report on Actic Group will help you shine a light on its historical performance.Do Revenue Forecasts Match The Low P/S Ratio?
In order to justify its P/S ratio, Actic Group would need to produce sluggish growth that's trailing the industry.
If we review the last year of revenue, the company posted a result that saw barely any deviation from a year ago. Still, the latest three year period was better as it's delivered a decent 9.4% overall rise in revenue. Therefore, it's fair to say that revenue growth has been inconsistent recently for the company.
This is in contrast to the rest of the industry, which is expected to grow by 13% over the next year, materially higher than the company's recent medium-term annualised growth rates.
With this in consideration, it's easy to understand why Actic Group's P/S falls short of the mark set by its industry peers. It seems most investors are expecting to see the recent limited growth rates continue into the future and are only willing to pay a reduced amount for the stock.
The Key Takeaway
The southerly movements of Actic Group's shares means its P/S is now sitting at a pretty low level. Typically, we'd caution against reading too much into price-to-sales ratios when settling on investment decisions, though it can reveal plenty about what other market participants think about the company.
As we suspected, our examination of Actic Group revealed its three-year revenue trends are contributing to its low P/S, given they look worse than current industry expectations. Right now shareholders are accepting the low P/S as they concede future revenue probably won't provide any pleasant surprises. If recent medium-term revenue trends continue, it's hard to see the share price experience a reversal of fortunes anytime soon.
You should always think about risks. Case in point, we've spotted 3 warning signs for Actic Group you should be aware of, and 1 of them is concerning.
If companies with solid past earnings growth is up your alley, you may wish to see this free collection of other companies with strong earnings growth and low P/E ratios.
New: Manage All Your Stock Portfolios in One Place
We've created the ultimate portfolio companion for stock investors, and it's free.
• Connect an unlimited number of Portfolios and see your total in one currency
• Be alerted to new Warning Signs or Risks via email or mobile
• Track the Fair Value of your stocks
Have feedback on this article? Concerned about the content? Get in touch with us directly. Alternatively, email editorial-team (at) simplywallst.com.
This article by Simply Wall St is general in nature. We provide commentary based on historical data and analyst forecasts only using an unbiased methodology and our articles are not intended to be financial advice. It does not constitute a recommendation to buy or sell any stock, and does not take account of your objectives, or your financial situation. We aim to bring you long-term focused analysis driven by fundamental data. Note that our analysis may not factor in the latest price-sensitive company announcements or qualitative material. Simply Wall St has no position in any stocks mentioned.
About OM:ATIC
Actic Group
Operates gyms, swimming, and wellness facilities in Sweden, Norway, and Germany.
Good value with acceptable track record.
Market Insights

Advertisement
Weekly Picks
RO


RockeTeller on Santacruz Silver Mining ·
Crazy Undervalued 42 Baggers Silver Play (Active & Running Mine)
Fair Value:CA$8696.4% undervalued
38 followersusers have followed this narrative
6 commentsusers have commented on this narrative
10 likesusers have liked this narrative
RO


Robbo on Fiducian Group ·
Fiducian: Compliance Clouds or Value Opportunity?
Fair Value:AU$126.1% undervalued
4 followersusers have followed this narrative
0 commentsusers have commented on this narrative
0 likesusers have liked this narrative
WO

woodworthfund on Willamette Valley Vineyards ·
Willamette Valley Vineyards (WVVI): Not-So-Great Value
Fair Value:US$244.5% overvalued
6 followersusers have followed this narrative
0 commentsusers have commented on this narrative
1 likeusers have liked this narrative
Recently Updated Narratives
FU

FundamentallySarcastic on Credit Corp Group ·
Moderation and Stabilisation: HOLD: Fair Price based on a 4-year Cycle is $12.08
Fair Value:AU$12.6411.4% overvalued
1 followerusers have followed this narrative
0 commentsusers have commented on this narrative
0 likesusers have liked this narrative
MA


MarkoVT on Alphabet ·
Positioned globally, partnered locally
Fair Value:US$390.1918.1% undervalued
2 followersusers have followed this narrative
0 commentsusers have commented on this narrative
0 likesusers have liked this narrative
JO


JohnJ on Worldline ·
When will fraudsters be investigated in depth. Fraud was ongoing in France too.
Fair Value:€0.5190.0% overvalued
1 followerusers have followed this narrative
0 commentsusers have commented on this narrative
0 likesusers have liked this narrative
Popular Narratives
TH


TheWallstreetKing on MicroVision ·
MicroVision will explode future revenue by 380.37% with a vision towards success
Fair Value:US$6098.5% undervalued
114 followersusers have followed this narrative
11 commentsusers have commented on this narrative
22 likesusers have liked this narrative
AN


AnalystConsensusTarget on NVIDIA ·
NVDA: Expanding AI Demand Will Drive Major Data Center Investments Through 2026
Fair Value:US$250.3928.3% undervalued
952 followersusers have followed this narrative
6 commentsusers have commented on this narrative
25 likesusers have liked this narrative
OS

oscargarcia on Alphabet ·
The company that turned a verb into a global necessity and basically runs the modern internet, digital ads, smartphones, maps, and AI.
Fair Value:US$3406.0% undervalued
148 followersusers have followed this narrative
6 commentsusers have commented on this narrative
18 likesusers have liked this narrative

