These 4 Measures Indicate That Thule Group (STO:THULE) Is Using Debt Extensively


Legendary fund manager Li Lu (who Charlie Munger backed) once said, 'The biggest investment risk is not the volatility of prices, but whether you will suffer a permanent loss of capital.' When we think about how risky a company is, we always like to look at its use of debt, since debt overload can lead to ruin. We note that Thule Group AB (publ) (STO:THULE) does have debt on its balance sheet. But the more important question is: how much risk is that debt creating?
When Is Debt A Problem?
Debt is a tool to help businesses grow, but if a business is incapable of paying off its lenders, then it exists at their mercy. Part and parcel of capitalism is the process of 'creative destruction' where failed businesses are mercilessly liquidated by their bankers. However, a more usual (but still expensive) situation is where a company must dilute shareholders at a cheap share price simply to get debt under control. Having said that, the most common situation is where a company manages its debt reasonably well - and to its own advantage. The first step when considering a company's debt levels is to consider its cash and debt together.
View our latest analysis for Thule Group
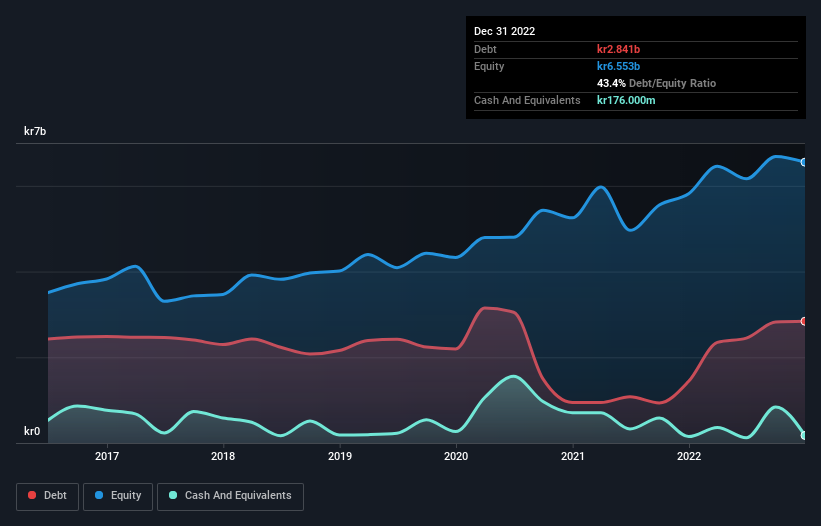
What Is Thule Group's Debt?
As you can see below, at the end of December 2022, Thule Group had kr2.84b of debt, up from kr1.44b a year ago. Click the image for more detail. However, it also had kr176.0m in cash, and so its net debt is kr2.67b.
How Strong Is Thule Group's Balance Sheet?
Zooming in on the latest balance sheet data, we can see that Thule Group had liabilities of kr1.59b due within 12 months and liabilities of kr3.53b due beyond that. On the other hand, it had cash of kr176.0m and kr932.0m worth of receivables due within a year. So its liabilities outweigh the sum of its cash and (near-term) receivables by kr4.02b.
Of course, Thule Group has a market capitalization of kr26.6b, so these liabilities are probably manageable. Having said that, it's clear that we should continue to monitor its balance sheet, lest it change for the worse.
We use two main ratios to inform us about debt levels relative to earnings. The first is net debt divided by earnings before interest, tax, depreciation, and amortization (EBITDA), while the second is how many times its earnings before interest and tax (EBIT) covers its interest expense (or its interest cover, for short). The advantage of this approach is that we take into account both the absolute quantum of debt (with net debt to EBITDA) and the actual interest expenses associated with that debt (with its interest cover ratio).
Thule Group's net debt is only 1.4 times its EBITDA. And its EBIT easily covers its interest expense, being 2k times the size. So we're pretty relaxed about its super-conservative use of debt. In fact Thule Group's saving grace is its low debt levels, because its EBIT has tanked 27% in the last twelve months. When it comes to paying off debt, falling earnings are no more useful than sugary sodas are for your health. The balance sheet is clearly the area to focus on when you are analysing debt. But it is future earnings, more than anything, that will determine Thule Group's ability to maintain a healthy balance sheet going forward. So if you want to see what the professionals think, you might find this free report on analyst profit forecasts to be interesting.
Finally, a business needs free cash flow to pay off debt; accounting profits just don't cut it. So the logical step is to look at the proportion of that EBIT that is matched by actual free cash flow. Looking at the most recent three years, Thule Group recorded free cash flow of 40% of its EBIT, which is weaker than we'd expect. That's not great, when it comes to paying down debt.
Our View
Neither Thule Group's ability to grow its EBIT nor its conversion of EBIT to free cash flow gave us confidence in its ability to take on more debt. But its interest cover tells a very different story, and suggests some resilience. We think that Thule Group's debt does make it a bit risky, after considering the aforementioned data points together. Not all risk is bad, as it can boost share price returns if it pays off, but this debt risk is worth keeping in mind. There's no doubt that we learn most about debt from the balance sheet. However, not all investment risk resides within the balance sheet - far from it. For example - Thule Group has 2 warning signs we think you should be aware of.
When all is said and done, sometimes its easier to focus on companies that don't even need debt. Readers can access a list of growth stocks with zero net debt 100% free, right now.
If you're looking to trade Thule Group, open an account with the lowest-cost platform trusted by professionals, Interactive Brokers.
With clients in over 200 countries and territories, and access to 160 markets, IBKR lets you trade stocks, options, futures, forex, bonds and funds from a single integrated account.
Enjoy no hidden fees, no account minimums, and FX conversion rates as low as 0.03%, far better than what most brokers offer.
Sponsored ContentValuation is complex, but we're here to simplify it.
Discover if Thule Group might be undervalued or overvalued with our detailed analysis, featuring fair value estimates, potential risks, dividends, insider trades, and its financial condition.
Access Free AnalysisHave feedback on this article? Concerned about the content? Get in touch with us directly. Alternatively, email editorial-team (at) simplywallst.com.
This article by Simply Wall St is general in nature. We provide commentary based on historical data and analyst forecasts only using an unbiased methodology and our articles are not intended to be financial advice. It does not constitute a recommendation to buy or sell any stock, and does not take account of your objectives, or your financial situation. We aim to bring you long-term focused analysis driven by fundamental data. Note that our analysis may not factor in the latest price-sensitive company announcements or qualitative material. Simply Wall St has no position in any stocks mentioned.
About OM:THULE
Good value with adequate balance sheet and pays a dividend.
Similar Companies
Market Insights

Community Narratives

