

Warren Buffett famously said, 'Volatility is far from synonymous with risk.' So it seems the smart money knows that debt - which is usually involved in bankruptcies - is a very important factor, when you assess how risky a company is. Importantly, Thule Group AB (publ) (STO:THULE) does carry debt. But is this debt a concern to shareholders?
When Is Debt A Problem?
Generally speaking, debt only becomes a real problem when a company can't easily pay it off, either by raising capital or with its own cash flow. Part and parcel of capitalism is the process of 'creative destruction' where failed businesses are mercilessly liquidated by their bankers. While that is not too common, we often do see indebted companies permanently diluting shareholders because lenders force them to raise capital at a distressed price. Of course, plenty of companies use debt to fund growth, without any negative consequences. When we think about a company's use of debt, we first look at cash and debt together.
Check out our latest analysis for Thule Group
What Is Thule Group's Net Debt?
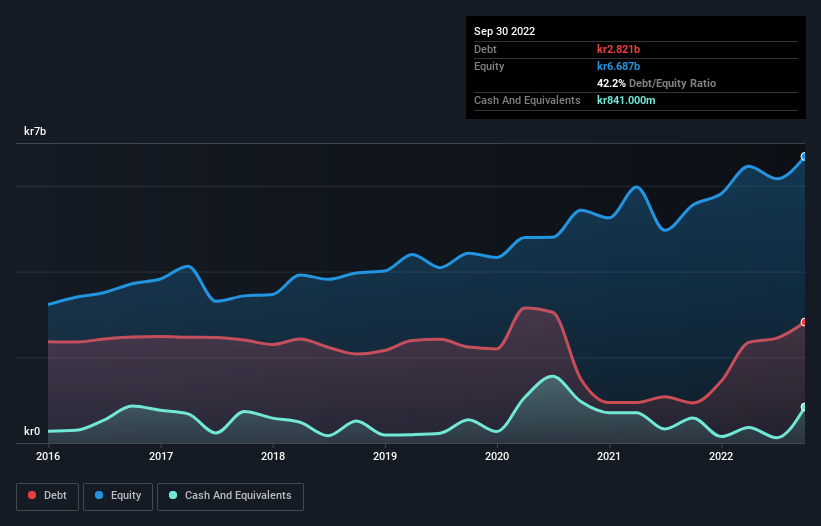
You can click the graphic below for the historical numbers, but it shows that as of September 2022 Thule Group had kr2.82b of debt, an increase on kr935.0m, over one year. However, it also had kr841.0m in cash, and so its net debt is kr1.98b.
A Look At Thule Group's Liabilities
Zooming in on the latest balance sheet data, we can see that Thule Group had liabilities of kr2.41b due within 12 months and liabilities of kr3.51b due beyond that. Offsetting these obligations, it had cash of kr841.0m as well as receivables valued at kr1.18b due within 12 months. So its liabilities total kr3.90b more than the combination of its cash and short-term receivables.
Of course, Thule Group has a market capitalization of kr23.4b, so these liabilities are probably manageable. But there are sufficient liabilities that we would certainly recommend shareholders continue to monitor the balance sheet, going forward.
In order to size up a company's debt relative to its earnings, we calculate its net debt divided by its earnings before interest, tax, depreciation, and amortization (EBITDA) and its earnings before interest and tax (EBIT) divided by its interest expense (its interest cover). Thus we consider debt relative to earnings both with and without depreciation and amortization expenses.
Thule Group has a low net debt to EBITDA ratio of only 0.99. And its EBIT covers its interest expense a whopping 45.7 times over. So we're pretty relaxed about its super-conservative use of debt. In fact Thule Group's saving grace is its low debt levels, because its EBIT has tanked 22% in the last twelve months. When a company sees its earnings tank, it can sometimes find its relationships with its lenders turn sour. The balance sheet is clearly the area to focus on when you are analysing debt. But it is future earnings, more than anything, that will determine Thule Group's ability to maintain a healthy balance sheet going forward. So if you want to see what the professionals think, you might find this free report on analyst profit forecasts to be interesting.
Finally, a company can only pay off debt with cold hard cash, not accounting profits. So the logical step is to look at the proportion of that EBIT that is matched by actual free cash flow. Looking at the most recent three years, Thule Group recorded free cash flow of 41% of its EBIT, which is weaker than we'd expect. That's not great, when it comes to paying down debt.
Our View
Neither Thule Group's ability to grow its EBIT nor its conversion of EBIT to free cash flow gave us confidence in its ability to take on more debt. But its interest cover tells a very different story, and suggests some resilience. Looking at all the angles mentioned above, it does seem to us that Thule Group is a somewhat risky investment as a result of its debt. That's not necessarily a bad thing, since leverage can boost returns on equity, but it is something to be aware of. The balance sheet is clearly the area to focus on when you are analysing debt. But ultimately, every company can contain risks that exist outside of the balance sheet. We've identified 3 warning signs with Thule Group , and understanding them should be part of your investment process.
If, after all that, you're more interested in a fast growing company with a rock-solid balance sheet, then check out our list of net cash growth stocks without delay.
If you're looking to trade Thule Group, open an account with the lowest-cost platform trusted by professionals, Interactive Brokers.
With clients in over 200 countries and territories, and access to 160 markets, IBKR lets you trade stocks, options, futures, forex, bonds and funds from a single integrated account.
Enjoy no hidden fees, no account minimums, and FX conversion rates as low as 0.03%, far better than what most brokers offer.
Sponsored ContentValuation is complex, but we're here to simplify it.
Discover if Thule Group might be undervalued or overvalued with our detailed analysis, featuring fair value estimates, potential risks, dividends, insider trades, and its financial condition.
Access Free AnalysisHave feedback on this article? Concerned about the content? Get in touch with us directly. Alternatively, email editorial-team (at) simplywallst.com.
This article by Simply Wall St is general in nature. We provide commentary based on historical data and analyst forecasts only using an unbiased methodology and our articles are not intended to be financial advice. It does not constitute a recommendation to buy or sell any stock, and does not take account of your objectives, or your financial situation. We aim to bring you long-term focused analysis driven by fundamental data. Note that our analysis may not factor in the latest price-sensitive company announcements or qualitative material. Simply Wall St has no position in any stocks mentioned.
About OM:THULE
Good value with adequate balance sheet and pays a dividend.
Similar Companies
Market Insights

Community Narratives

