- Sweden
- /
- Consumer Durables
- /
- OM:STRAX
Strax AB (publ)'s (STO:STRAX) Shares Bounce 46% But Its Business Still Trails The Industry


Strax AB (publ) (STO:STRAX) shareholders are no doubt pleased to see that the share price has bounced 46% in the last month, although it is still struggling to make up recently lost ground. Still, the 30-day jump doesn't change the fact that longer term shareholders have seen their stock decimated by the 81% share price drop in the last twelve months.
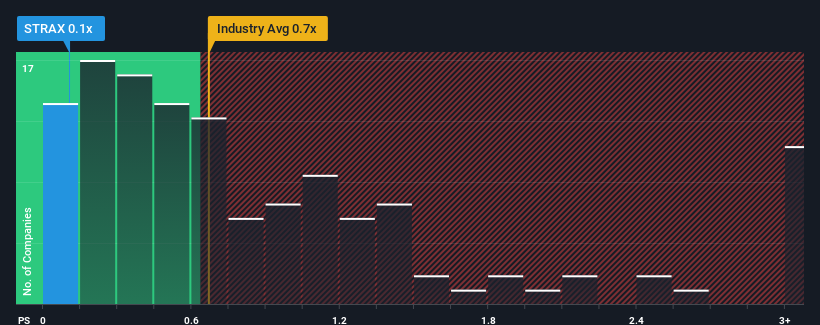
In spite of the firm bounce in price, when close to half the companies operating in Sweden's Consumer Durables industry have price-to-sales ratios (or "P/S") above 0.8x, you may still consider Strax as an enticing stock to check out with its 0.1x P/S ratio. Nonetheless, we'd need to dig a little deeper to determine if there is a rational basis for the reduced P/S.
View our latest analysis for Strax
What Does Strax's P/S Mean For Shareholders?
Strax could be doing better as its revenue has been going backwards lately while most other companies have been seeing positive revenue growth. It seems that many are expecting the poor revenue performance to persist, which has repressed the P/S ratio. If you still like the company, you'd be hoping this isn't the case so that you could potentially pick up some stock while it's out of favour.
Keen to find out how analysts think Strax's future stacks up against the industry? In that case, our free report is a great place to start.How Is Strax's Revenue Growth Trending?
In order to justify its P/S ratio, Strax would need to produce sluggish growth that's trailing the industry.
Taking a look back first, the company's revenue growth last year wasn't something to get excited about as it posted a disappointing decline of 71%. This means it has also seen a slide in revenue over the longer-term as revenue is down 73% in total over the last three years. Accordingly, shareholders would have felt downbeat about the medium-term rates of revenue growth.
Shifting to the future, estimates from the sole analyst covering the company are not good at all, suggesting revenue should decline by 9.1% each year over the next three years. Meanwhile, the broader industry is forecast to moderate by 0.9% per year, which indicates the company should perform poorly indeed.
With this in consideration, it's clear to us why Strax's P/S isn't quite up to scratch with its industry peers. Nonetheless, with revenue going quickly in reverse, it's not guaranteed that the P/S has found a floor yet. Even just maintaining these prices could be difficult to achieve as the weak outlook is already weighing down the shares heavily.
What We Can Learn From Strax's P/S?
Despite Strax's share price climbing recently, its P/S still lags most other companies. Typically, we'd caution against reading too much into price-to-sales ratios when settling on investment decisions, though it can reveal plenty about what other market participants think about the company.
We've established that Strax's P/S is about what we expect, seeing as the P/S and revenue growth forecasts are lower than that of an already struggling industry. Right now shareholders are accepting the low P/S as they concede future revenue probably won't provide any pleasant surprises. Typically when industry conditions are tough, there's a real risk of company revenues sliding further, which is a concern of ours in this case. In the meantime, unless the company's prospects improve they will continue to form a barrier for the share price around these levels.
Before you take the next step, you should know about the 3 warning signs for Strax that we have uncovered.
If you're unsure about the strength of Strax's business, why not explore our interactive list of stocks with solid business fundamentals for some other companies you may have missed.
If you're looking to trade Strax, open an account with the lowest-cost platform trusted by professionals, Interactive Brokers.
With clients in over 200 countries and territories, and access to 160 markets, IBKR lets you trade stocks, options, futures, forex, bonds and funds from a single integrated account.
Enjoy no hidden fees, no account minimums, and FX conversion rates as low as 0.03%, far better than what most brokers offer.
Sponsored ContentNew: Manage All Your Stock Portfolios in One Place
We've created the ultimate portfolio companion for stock investors, and it's free.
• Connect an unlimited number of Portfolios and see your total in one currency
• Be alerted to new Warning Signs or Risks via email or mobile
• Track the Fair Value of your stocks
Have feedback on this article? Concerned about the content? Get in touch with us directly. Alternatively, email editorial-team (at) simplywallst.com.
This article by Simply Wall St is general in nature. We provide commentary based on historical data and analyst forecasts only using an unbiased methodology and our articles are not intended to be financial advice. It does not constitute a recommendation to buy or sell any stock, and does not take account of your objectives, or your financial situation. We aim to bring you long-term focused analysis driven by fundamental data. Note that our analysis may not factor in the latest price-sensitive company announcements or qualitative material. Simply Wall St has no position in any stocks mentioned.
About OM:STRAX
Strax
Designs, develops, manufactures, and sells mobile accessories worldwide.
Moderate and slightly overvalued.
Market Insights

Community Narratives

