
Advertisement
- Sweden
- /
- Consumer Durables
- /
- OM:ELUX B
Investors in AB Electrolux (STO:ELUX B) have unfortunately lost 35% over the last three years

Many investors define successful investing as beating the market average over the long term. But in any portfolio, there are likely to be some stocks that fall short of that benchmark. We regret to report that long term AB Electrolux (publ) (STO:ELUX B) shareholders have had that experience, with the share price dropping 40% in three years, versus a market return of about 15%. Even worse, it's down 8.9% in about a month, which isn't fun at all. But this could be related to poor market conditions -- stocks are down 4.3% in the same time.
It's worthwhile assessing if the company's economics have been moving in lockstep with these underwhelming shareholder returns, or if there is some disparity between the two. So let's do just that.
Because AB Electrolux made a loss in the last twelve months, we think the market is probably more focussed on revenue and revenue growth, at least for now. Generally speaking, companies without profits are expected to grow revenue every year, and at a good clip. That's because it's hard to be confident a company will be sustainable if revenue growth is negligible, and it never makes a profit.
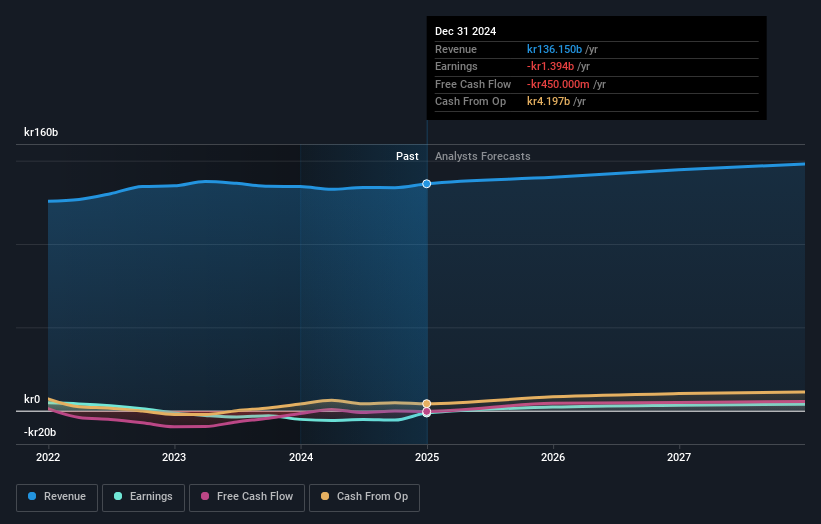
Over three years, AB Electrolux grew revenue at 1.7% per year. That's not a very high growth rate considering it doesn't make profits. The stock dropped 12% during that time. If revenue growth accelerates, we might see the share price bounce. But the real upside for shareholders will be if the company can start generating profits.
You can see how earnings and revenue have changed over time in the image below (click on the chart to see the exact values).
AB Electrolux is well known by investors, and plenty of clever analysts have tried to predict the future profit levels. You can see what analysts are predicting for AB Electrolux in this interactive graph of future profit estimates.
What About The Total Shareholder Return (TSR)?
We've already covered AB Electrolux's share price action, but we should also mention its total shareholder return (TSR). The TSR is a return calculation that accounts for the value of cash dividends (assuming that any dividend received was reinvested) and the calculated value of any discounted capital raisings and spin-offs. Its history of dividend payouts mean that AB Electrolux's TSR, which was a 35% drop over the last 3 years, was not as bad as the share price return.
A Different Perspective
AB Electrolux shareholders are down 5.2% for the year, but the market itself is up 4.4%. However, keep in mind that even the best stocks will sometimes underperform the market over a twelve month period. Regrettably, last year's performance caps off a bad run, with the shareholders facing a total loss of 1.3% per year over five years. Generally speaking long term share price weakness can be a bad sign, though contrarian investors might want to research the stock in hope of a turnaround. I find it very interesting to look at share price over the long term as a proxy for business performance. But to truly gain insight, we need to consider other information, too. To that end, you should be aware of the 1 warning sign we've spotted with AB Electrolux .
We will like AB Electrolux better if we see some big insider buys. While we wait, check out this free list of undervalued stocks (mostly small caps) with considerable, recent, insider buying.
Please note, the market returns quoted in this article reflect the market weighted average returns of stocks that currently trade on Swedish exchanges.
New: Manage All Your Stock Portfolios in One Place
We've created the ultimate portfolio companion for stock investors, and it's free.
• Connect an unlimited number of Portfolios and see your total in one currency
• Be alerted to new Warning Signs or Risks via email or mobile
• Track the Fair Value of your stocks
Have feedback on this article? Concerned about the content? Get in touch with us directly. Alternatively, email editorial-team (at) simplywallst.com.
This article by Simply Wall St is general in nature. We provide commentary based on historical data and analyst forecasts only using an unbiased methodology and our articles are not intended to be financial advice. It does not constitute a recommendation to buy or sell any stock, and does not take account of your objectives, or your financial situation. We aim to bring you long-term focused analysis driven by fundamental data. Note that our analysis may not factor in the latest price-sensitive company announcements or qualitative material. Simply Wall St has no position in any stocks mentioned.
About OM:ELUX B
Undervalued with reasonable growth potential.
Similar Companies
Market Insights

Advertisement
Community Narratives
Groundbreaking therapies that could change the treatment landscape for PTSD, fibromyalgia, MS & Alzheimer’s
Fair Value US$6.20|86.9% undervalued
CM
Community Contributor
DigitalOcean Will Grow 14% by Embracing AI with Paperspace Acquisition
Fair Value US$50.00|42.8% undervalued
NE
Community Contributor
Viant Technology: A Rising AdTech Challenger in the AI-Powered CTV Market
Fair Value US$38.61|66.0% undervalued
BL
Community Contributor
Volvo will Accelerate Forward into Electric and Autonomous Leadership in Five Years
Fair Value SEK 438.80|40.8% undervalued
UN
Community Contributor