David Iben put it well when he said, 'Volatility is not a risk we care about. What we care about is avoiding the permanent loss of capital.' It's only natural to consider a company's balance sheet when you examine how risky it is, since debt is often involved when a business collapses. We note that Intrum AB (publ) (STO:INTRUM) does have debt on its balance sheet. But the real question is whether this debt is making the company risky.
When Is Debt A Problem?
Debt and other liabilities become risky for a business when it cannot easily fulfill those obligations, either with free cash flow or by raising capital at an attractive price. Ultimately, if the company can't fulfill its legal obligations to repay debt, shareholders could walk away with nothing. However, a more usual (but still expensive) situation is where a company must dilute shareholders at a cheap share price simply to get debt under control. Having said that, the most common situation is where a company manages its debt reasonably well - and to its own advantage. When we examine debt levels, we first consider both cash and debt levels, together.
View our latest analysis for Intrum
How Much Debt Does Intrum Carry?
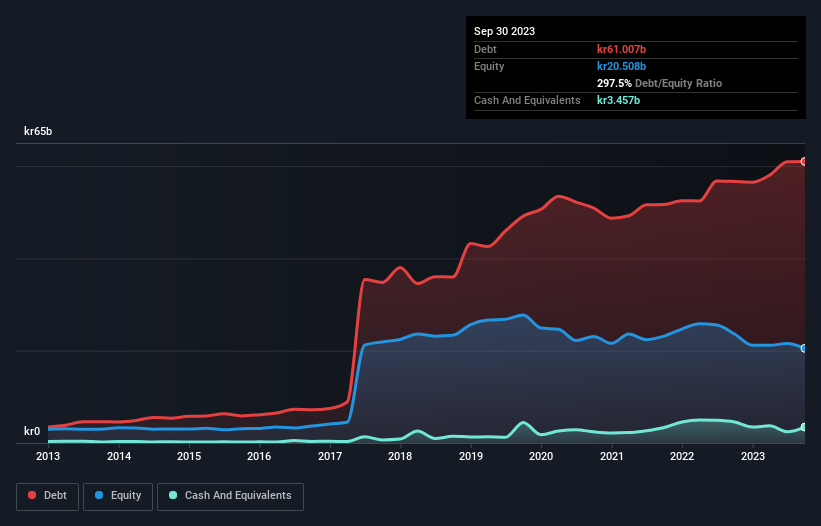
As you can see below, at the end of September 2023, Intrum had kr61.0b of debt, up from kr56.7b a year ago. Click the image for more detail. However, it also had kr3.46b in cash, and so its net debt is kr57.6b.

How Healthy Is Intrum's Balance Sheet?
Zooming in on the latest balance sheet data, we can see that Intrum had liabilities of kr15.7b due within 12 months and liabilities of kr56.5b due beyond that. Offsetting this, it had kr3.46b in cash and kr4.67b in receivables that were due within 12 months. So it has liabilities totalling kr64.1b more than its cash and near-term receivables, combined.
This deficit casts a shadow over the kr6.89b company, like a colossus towering over mere mortals. So we'd watch its balance sheet closely, without a doubt. After all, Intrum would likely require a major re-capitalisation if it had to pay its creditors today.
In order to size up a company's debt relative to its earnings, we calculate its net debt divided by its earnings before interest, tax, depreciation, and amortization (EBITDA) and its earnings before interest and tax (EBIT) divided by its interest expense (its interest cover). This way, we consider both the absolute quantum of the debt, as well as the interest rates paid on it.
Weak interest cover of 1.7 times and a disturbingly high net debt to EBITDA ratio of 11.8 hit our confidence in Intrum like a one-two punch to the gut. The debt burden here is substantial. The good news is that Intrum improved its EBIT by 2.7% over the last twelve months, thus gradually reducing its debt levels relative to its earnings. The balance sheet is clearly the area to focus on when you are analysing debt. But ultimately the future profitability of the business will decide if Intrum can strengthen its balance sheet over time. So if you're focused on the future you can check out this free report showing analyst profit forecasts.
Finally, while the tax-man may adore accounting profits, lenders only accept cold hard cash. So we always check how much of that EBIT is translated into free cash flow. Over the last three years, Intrum actually produced more free cash flow than EBIT. That sort of strong cash generation warms our hearts like a puppy in a bumblebee suit.
Our View
On the face of it, Intrum's net debt to EBITDA left us tentative about the stock, and its level of total liabilities was no more enticing than the one empty restaurant on the busiest night of the year. But on the bright side, its conversion of EBIT to free cash flow is a good sign, and makes us more optimistic. Overall, we think it's fair to say that Intrum has enough debt that there are some real risks around the balance sheet. If everything goes well that may pay off but the downside of this debt is a greater risk of permanent losses. There's no doubt that we learn most about debt from the balance sheet. But ultimately, every company can contain risks that exist outside of the balance sheet. To that end, you should learn about the 3 warning signs we've spotted with Intrum (including 1 which is potentially serious) .
Of course, if you're the type of investor who prefers buying stocks without the burden of debt, then don't hesitate to discover our exclusive list of net cash growth stocks, today.
New: AI Stock Screener & Alerts
Our new AI Stock Screener scans the market every day to uncover opportunities.
• Dividend Powerhouses (3%+ Yield)
• Undervalued Small Caps with Insider Buying
• High growth Tech and AI Companies
Or build your own from over 50 metrics.
Have feedback on this article? Concerned about the content? Get in touch with us directly. Alternatively, email editorial-team (at) simplywallst.com.
This article by Simply Wall St is general in nature. We provide commentary based on historical data and analyst forecasts only using an unbiased methodology and our articles are not intended to be financial advice. It does not constitute a recommendation to buy or sell any stock, and does not take account of your objectives, or your financial situation. We aim to bring you long-term focused analysis driven by fundamental data. Note that our analysis may not factor in the latest price-sensitive company announcements or qualitative material. Simply Wall St has no position in any stocks mentioned.
About OM:INTRUM
Intrum
Provides payment solutions, and credit and collection services in Europe and internationally.
Very undervalued with low risk.
Similar Companies
Market Insights
Community Narratives


