
Advertisement
David Iben put it well when he said, 'Volatility is not a risk we care about. What we care about is avoiding the permanent loss of capital.' So it seems the smart money knows that debt - which is usually involved in bankruptcies - is a very important factor, when you assess how risky a company is. We can see that Hifab Group AB (publ) (STO:HIFA B) does use debt in its business. But is this debt a concern to shareholders?
Why Does Debt Bring Risk?
Debt assists a business until the business has trouble paying it off, either with new capital or with free cash flow. Part and parcel of capitalism is the process of 'creative destruction' where failed businesses are mercilessly liquidated by their bankers. However, a more common (but still painful) scenario is that it has to raise new equity capital at a low price, thus permanently diluting shareholders. Having said that, the most common situation is where a company manages its debt reasonably well - and to its own advantage. When we think about a company's use of debt, we first look at cash and debt together.
See our latest analysis for Hifab Group
What Is Hifab Group's Debt?
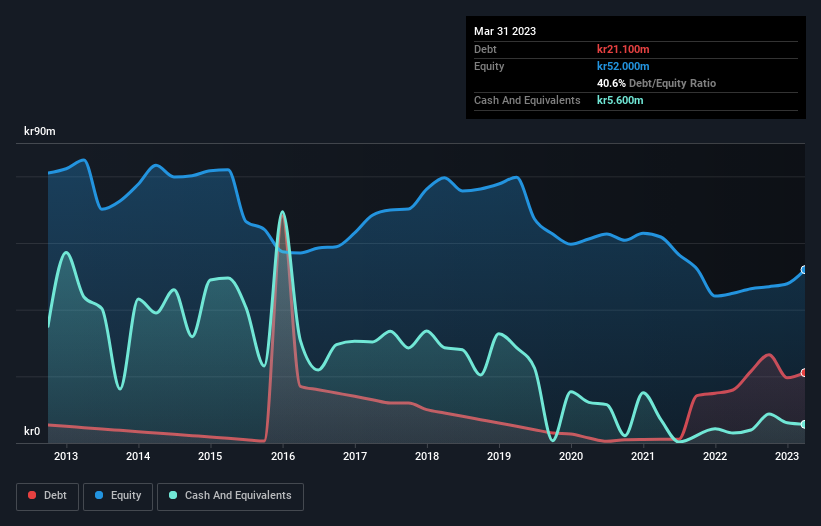
As you can see below, at the end of March 2023, Hifab Group had kr21.1m of debt, up from kr15.9m a year ago. Click the image for more detail. On the flip side, it has kr5.60m in cash leading to net debt of about kr15.5m.
How Healthy Is Hifab Group's Balance Sheet?
The latest balance sheet data shows that Hifab Group had liabilities of kr94.6m due within a year, and liabilities of kr12.1m falling due after that. Offsetting this, it had kr5.60m in cash and kr103.7m in receivables that were due within 12 months. So it can boast kr2.60m more liquid assets than total liabilities.
Having regard to Hifab Group's size, it seems that its liquid assets are well balanced with its total liabilities. So it's very unlikely that the kr175.2m company is short on cash, but still worth keeping an eye on the balance sheet.
In order to size up a company's debt relative to its earnings, we calculate its net debt divided by its earnings before interest, tax, depreciation, and amortization (EBITDA) and its earnings before interest and tax (EBIT) divided by its interest expense (its interest cover). This way, we consider both the absolute quantum of the debt, as well as the interest rates paid on it.
Hifab Group's net debt of 1.9 times EBITDA suggests graceful use of debt. And the fact that its trailing twelve months of EBIT was 7.1 times its interest expenses harmonizes with that theme. We also note that Hifab Group improved its EBIT from a last year's loss to a positive kr7.5m. When analysing debt levels, the balance sheet is the obvious place to start. But it is Hifab Group's earnings that will influence how the balance sheet holds up in the future. So when considering debt, it's definitely worth looking at the earnings trend. Click here for an interactive snapshot.
Finally, a company can only pay off debt with cold hard cash, not accounting profits. So it's worth checking how much of the earnings before interest and tax (EBIT) is backed by free cash flow. Over the last year, Hifab Group recorded free cash flow worth a fulsome 99% of its EBIT, which is stronger than we'd usually expect. That puts it in a very strong position to pay down debt.
Our View
Hifab Group's conversion of EBIT to free cash flow suggests it can handle its debt as easily as Cristiano Ronaldo could score a goal against an under 14's goalkeeper. And we also thought its level of total liabilities was a positive. When we consider the range of factors above, it looks like Hifab Group is pretty sensible with its use of debt. While that brings some risk, it can also enhance returns for shareholders. The balance sheet is clearly the area to focus on when you are analysing debt. However, not all investment risk resides within the balance sheet - far from it. Be aware that Hifab Group is showing 2 warning signs in our investment analysis , you should know about...
Of course, if you're the type of investor who prefers buying stocks without the burden of debt, then don't hesitate to discover our exclusive list of net cash growth stocks, today.
Valuation is complex, but we're here to simplify it.
Discover if Hifab Group might be undervalued or overvalued with our detailed analysis, featuring fair value estimates, potential risks, dividends, insider trades, and its financial condition.
Access Free AnalysisHave feedback on this article? Concerned about the content? Get in touch with us directly. Alternatively, email editorial-team (at) simplywallst.com.
This article by Simply Wall St is general in nature. We provide commentary based on historical data and analyst forecasts only using an unbiased methodology and our articles are not intended to be financial advice. It does not constitute a recommendation to buy or sell any stock, and does not take account of your objectives, or your financial situation. We aim to bring you long-term focused analysis driven by fundamental data. Note that our analysis may not factor in the latest price-sensitive company announcements or qualitative material. Simply Wall St has no position in any stocks mentioned.
About OM:HIFA B
Hifab Group
Provides project management and consulting services in Sweden, rest of Europe, Asia, and Africa.
Solid track record with excellent balance sheet and pays a dividend.
Market Insights

Advertisement
Community Narratives
Kodiak AI - a potential 100 bagger opportunity?
Fair Value US$14.00|44.7% undervalued
DA
Community Contributor
A Fair Price for a Great Business Facing Real Threats
Fair Value US$383.06|13.0% undervalued
IM
Community Contributor
AXON And Shopify Integration Will Unlock Global Mobile Advertising
Fair Value US$646.30|0% overvalued
AN
Based on Analyst Price Targets