Advertisement
- Sweden
- /
- Professional Services
- /
- OM:BTS B
3 European Dividend Stocks To Consider

Simply Wall St
Reviewed by Simply Wall St
As European markets navigate mixed returns and hopes for interest rate cuts, investors are paying close attention to economic indicators such as inflation and GDP growth. In this environment, dividend stocks can offer a stable income stream, making them an attractive option for those seeking potential resilience against market volatility.
Top 10 Dividend Stocks In Europe
| Name | Dividend Yield | Dividend Rating |
| Zurich Insurance Group (SWX:ZURN) | 4.33% | ★★★★★★ |
| Telekom Austria (WBAG:TKA) | 4.65% | ★★★★★★ |
| Swiss Re (SWX:SREN) | 4.57% | ★★★★★☆ |
| Holcim (SWX:HOLN) | 4.14% | ★★★★★★ |
| HEXPOL (OM:HPOL B) | 4.78% | ★★★★★★ |
| Evolution (OM:EVO) | 4.92% | ★★★★★★ |
| DKSH Holding (SWX:DKSH) | 4.13% | ★★★★★★ |
| Credito Emiliano (BIT:CE) | 5.20% | ★★★★★☆ |
| Cembra Money Bank (SWX:CMBN) | 4.39% | ★★★★★★ |
| Bravida Holding (OM:BRAV) | 4.44% | ★★★★★★ |
Click here to see the full list of 207 stocks from our Top European Dividend Stocks screener.
Let's dive into some prime choices out of the screener.
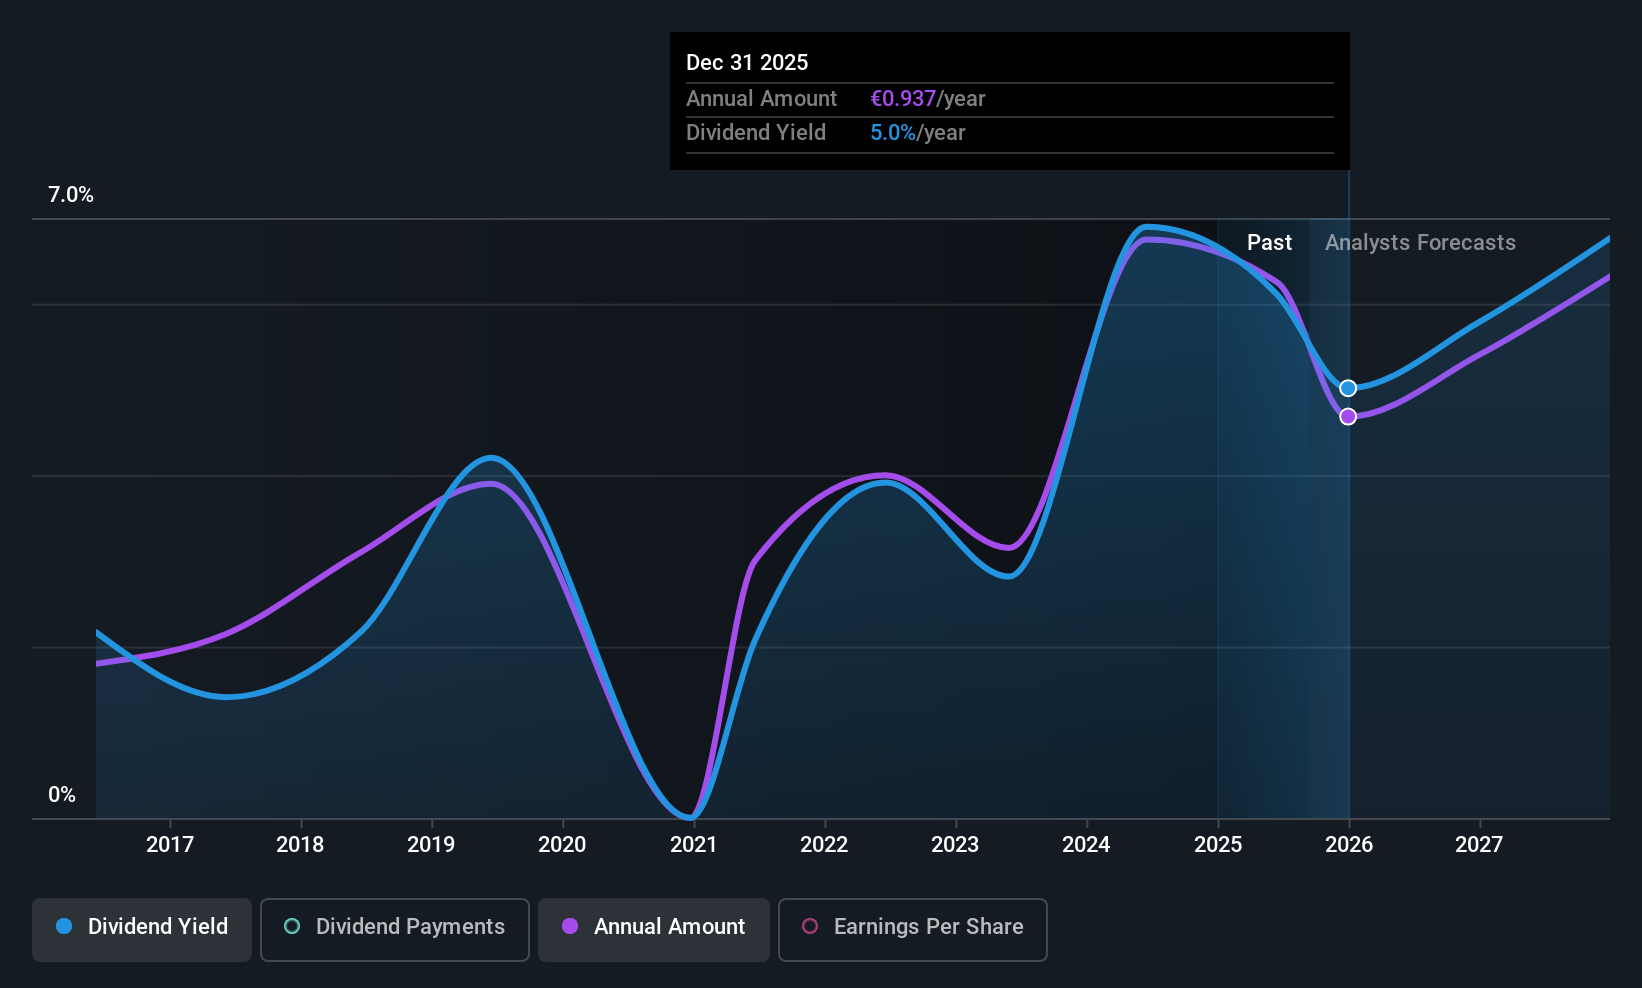
Manitou BF (ENXTPA:MTU)
Simply Wall St Dividend Rating: ★★★★★☆
Overview: Manitou BF SA, along with its subsidiaries, develops, manufactures, and distributes equipment and services across various regions including France, Southern Europe, Northern Europe, the Americas, Asia, the Pacific, Africa, and the Middle East; it has a market cap of €743.92 million.
Operations: Manitou BF generates revenue through its Products Division, which accounts for €2.11 billion, and its Services & Solutions (S&S) Division, contributing €416.52 million.
Dividend Yield: 6.4%
Manitou BF offers a compelling dividend profile with a payout ratio of 65.9% and cash payout ratio of 37.2%, ensuring dividends are well-covered by earnings and cash flows. Despite a volatile dividend history, its yield ranks in the top 25% in France, supported by good relative value with a P/E ratio of 10.2x against the market's 16.3x. Recent executive changes aim to enhance strategic growth through regional focus and innovation under the LIFT 2030 roadmap.
- Delve into the full analysis dividend report here for a deeper understanding of Manitou BF.
- Our valuation report unveils the possibility Manitou BF's shares may be trading at a discount.
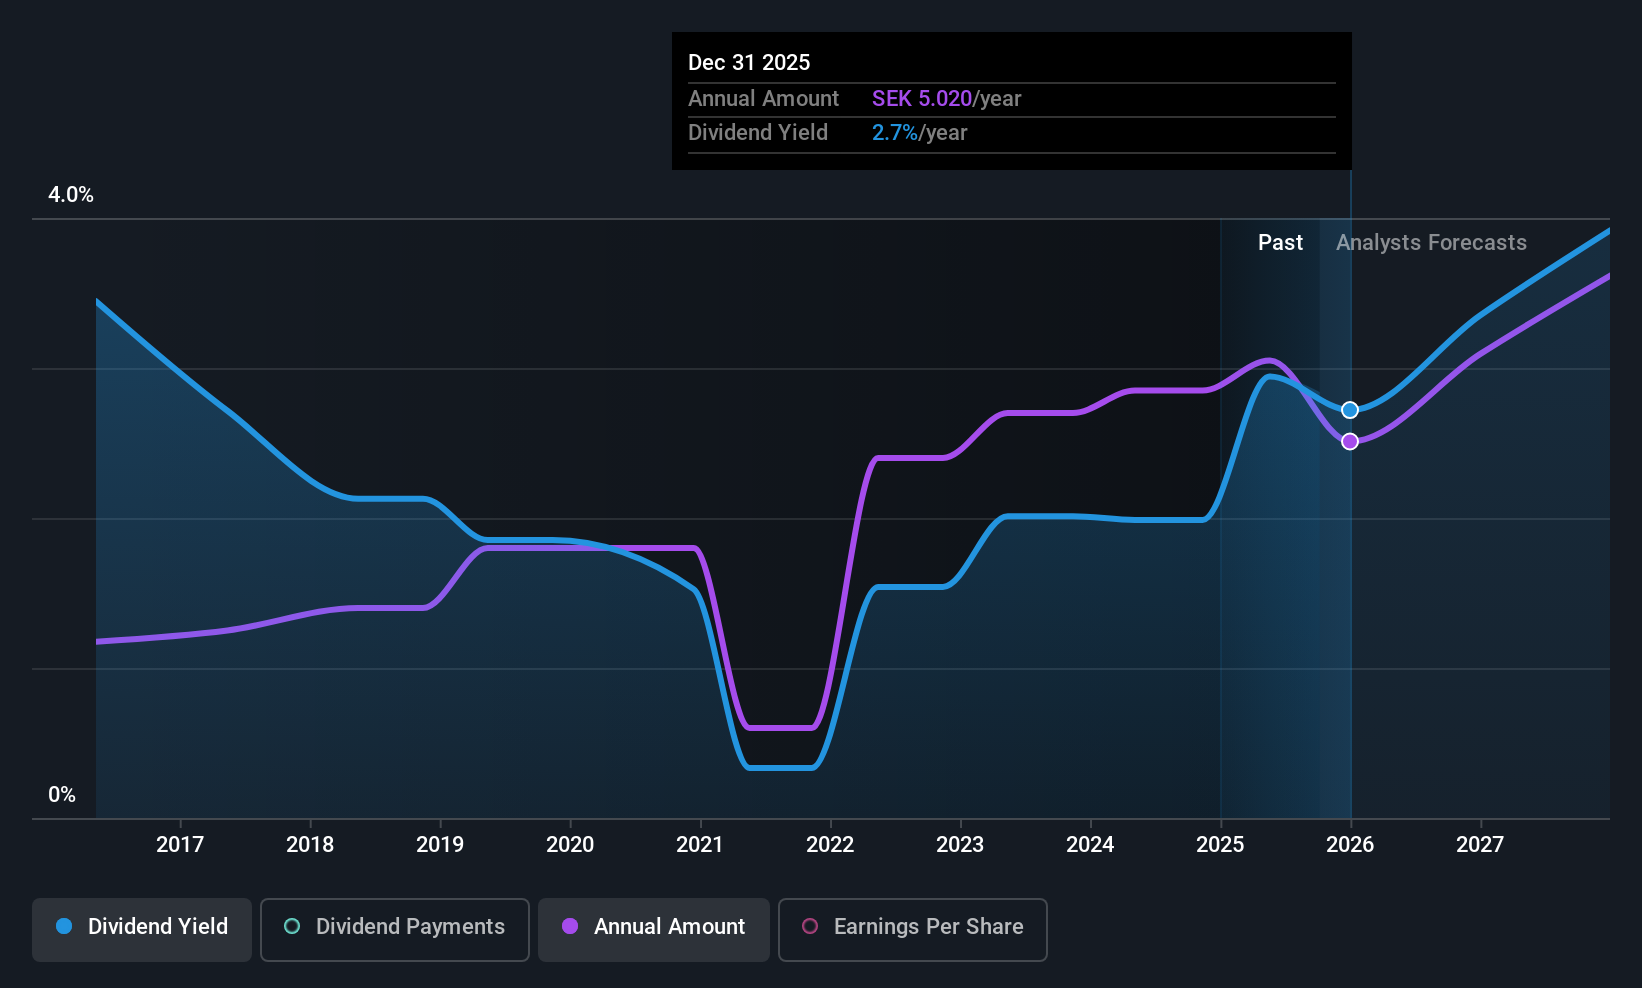
BTS Group (OM:BTS B)
Simply Wall St Dividend Rating: ★★★★★☆
Overview: BTS Group AB (publ) is a professional services firm with a market cap of SEK2.75 billion.
Operations: BTS Group AB (publ) generates revenue primarily from its segments in BTS North America (SEK1.50 billion), BTS Europe (SEK661.37 million), BTS Other Markets (SEK856.95 million), and Advantage Performance Group (APG) (SEK118.19 million).
Dividend Yield: 4.3%
BTS Group's dividends are supported by a payout ratio of 72.8% and a cash payout ratio of 67.8%, indicating coverage by earnings and cash flows despite an unstable dividend history. The dividend yield, at 4.3%, places it in the top quartile among Swedish payers, although recent guidance revisions suggest financial challenges with revenue projections lowered to THB 5.5 billion due to macroeconomic conditions impacting advertising and retail spending.
- Click here to discover the nuances of BTS Group with our detailed analytical dividend report.
- The analysis detailed in our BTS Group valuation report hints at an deflated share price compared to its estimated value.
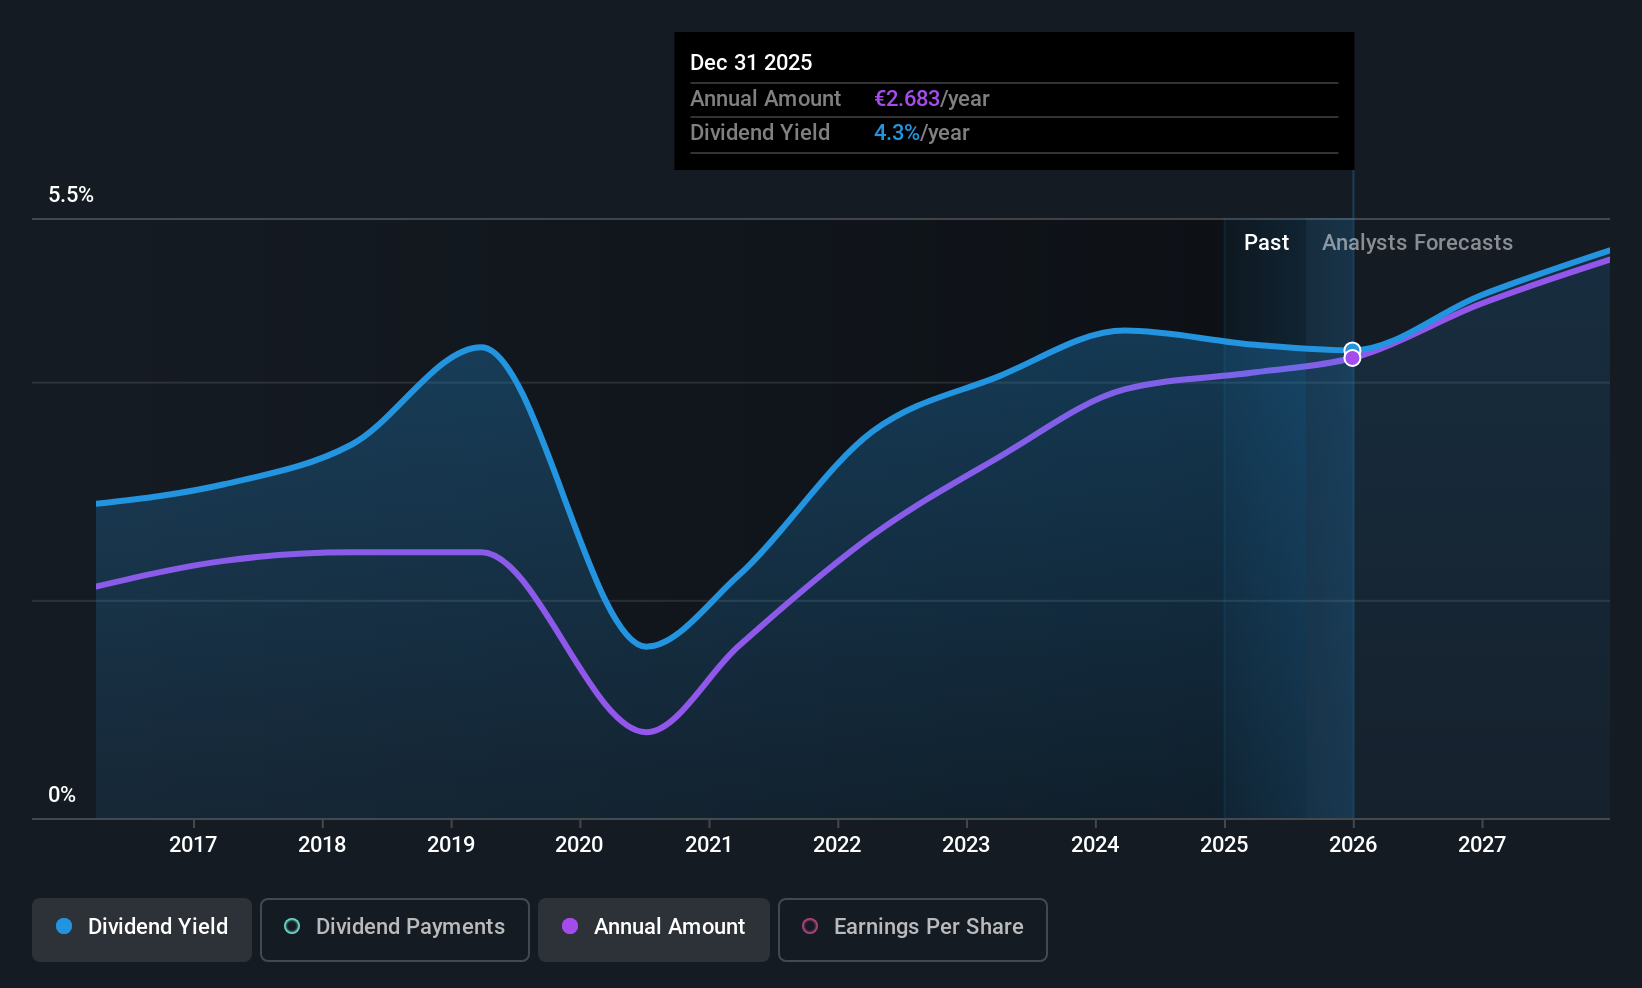
Andritz (WBAG:ANDR)
Simply Wall St Dividend Rating: ★★★★☆☆
Overview: Andritz AG provides industrial machinery, equipment, and services across multiple continents including Europe, North America, South America, China, Asia, Africa, and Australia with a market cap of €6.35 billion.
Operations: Andritz AG generates its revenue from four main segments: Metals (€1.68 billion), Hydro Power (€1.68 billion), Pulp & Paper (€2.94 billion), and Environment & Energy (€1.52 billion).
Dividend Yield: 4%
Andritz's dividends are supported by a payout ratio of 55.7% and a cash payout ratio of 74.2%, indicating coverage by earnings and cash flows despite a volatile dividend history over the past decade. Trading at 54.1% below its estimated fair value, it offers good relative value compared to peers, although its dividend yield of 3.99% falls short of Austria's top quartile payers. Recent earnings reports show decreased sales and net income year-over-year, yet full-year revenue guidance remains strong at EUR 8 billion to EUR 8.3 billion.
- Get an in-depth perspective on Andritz's performance by reading our dividend report here.
- Our expertly prepared valuation report Andritz implies its share price may be lower than expected.
Where To Now?
- Investigate our full lineup of 207 Top European Dividend Stocks right here.
- Have you diversified into these companies? Leverage the power of Simply Wall St's portfolio to keep a close eye on market movements affecting your investments.
- Discover a world of investment opportunities with Simply Wall St's free app and access unparalleled stock analysis across all markets.
Curious About Other Options?
- Explore high-performing small cap companies that haven't yet garnered significant analyst attention.
- Fuel your portfolio with companies showing strong growth potential, backed by optimistic outlooks both from analysts and management.
- Find companies with promising cash flow potential yet trading below their fair value.
This article by Simply Wall St is general in nature. We provide commentary based on historical data and analyst forecasts only using an unbiased methodology and our articles are not intended to be financial advice. It does not constitute a recommendation to buy or sell any stock, and does not take account of your objectives, or your financial situation. We aim to bring you long-term focused analysis driven by fundamental data. Note that our analysis may not factor in the latest price-sensitive company announcements or qualitative material. Simply Wall St has no position in any stocks mentioned.
Valuation is complex, but we're here to simplify it.
Discover if BTS Group might be undervalued or overvalued with our detailed analysis, featuring fair value estimates, potential risks, dividends, insider trades, and its financial condition.
Access Free AnalysisHave feedback on this article? Concerned about the content? Get in touch with us directly. Alternatively, email editorial-team@simplywallst.com
About OM:BTS B
Flawless balance sheet, undervalued and pays a dividend.
Market Insights

Advertisement
Weekly Picks
RO


RockeTeller on Santacruz Silver Mining ·
Crazy Undervalued 42 Baggers Silver Play (Active & Running Mine)
Fair Value:CA$8696.7% undervalued
65 followersusers have followed this narrative
7 commentsusers have commented on this narrative
19 likesusers have liked this narrative
RO


Robbo on Fiducian Group ·
Fiducian: Compliance Clouds or Value Opportunity?
Fair Value:AU$122.0% undervalued
9 followersusers have followed this narrative
0 commentsusers have commented on this narrative
0 likesusers have liked this narrative
WO

woodworthfund on Willamette Valley Vineyards ·
Willamette Valley Vineyards (WVVI): Not-So-Great Value
Fair Value:US$242.5% overvalued
11 followersusers have followed this narrative
0 commentsusers have commented on this narrative
1 likeusers have liked this narrative
Recently Updated Narratives
IN

IncomeAssets on Magma Silver ·
Silver's Breakout to over $50US will make Magma’s future shine with drill sampling returning 115g/t Silver and 2.3 g/t Gold at its Peru Mine
Fair Value:CA$0.3534.3% undervalued
1 followerusers have followed this narrative
0 commentsusers have commented on this narrative
0 likesusers have liked this narrative
CO

composite32 on SEGRO ·
SEGRO's Revenue to Rise 14.7% Amidst Optimistic Growth Plans
Fair Value:UK£9.3924.7% undervalued
0 followersusers have followed this narrative
0 commentsusers have commented on this narrative
0 likesusers have liked this narrative
PI

PicaCoder on Microsoft ·
After the AI Party: A Sobering Look at Microsoft's Future
Fair Value:US$42015.0% overvalued
62 followersusers have followed this narrative
12 commentsusers have commented on this narrative
0 likesusers have liked this narrative
Popular Narratives
TH


TheWallstreetKing on MicroVision ·
MicroVision will explode future revenue by 380.37% with a vision towards success
Fair Value:US$6098.5% undervalued
118 followersusers have followed this narrative
11 commentsusers have commented on this narrative
22 likesusers have liked this narrative
AN


AnalystConsensusTarget on NVIDIA ·
NVDA: Expanding AI Demand Will Drive Major Data Center Investments Through 2026
Fair Value:US$250.3927.2% undervalued
958 followersusers have followed this narrative
6 commentsusers have commented on this narrative
25 likesusers have liked this narrative
RO
RockeTeller on Santacruz Silver Mining ·
Crazy Undervalued 42 Baggers Silver Play (Active & Running Mine)
Fair Value:CA$8696.7% undervalued
65 followersusers have followed this narrative
7 commentsusers have commented on this narrative
19 likesusers have liked this narrative
