- Sweden
- /
- Construction
- /
- OM:VESTUM
Vestum AB (publ) (STO:VESTUM) Stock Rockets 28% As Investors Are Less Pessimistic Than Expected


Despite an already strong run, Vestum AB (publ) (STO:VESTUM) shares have been powering on, with a gain of 28% in the last thirty days. Still, the 30-day jump doesn't change the fact that longer term shareholders have seen their stock decimated by the 57% share price drop in the last twelve months.
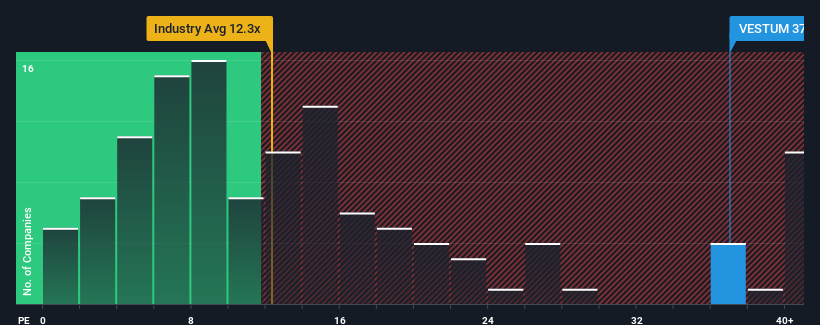
After such a large jump in price, Vestum's price-to-earnings (or "P/E") ratio of 37x might make it look like a strong sell right now compared to the market in Sweden, where around half of the companies have P/E ratios below 21x and even P/E's below 12x are quite common. Nonetheless, we'd need to dig a little deeper to determine if there is a rational basis for the highly elevated P/E.
Vestum hasn't been tracking well recently as its declining earnings compare poorly to other companies, which have seen some growth on average. One possibility is that the P/E is high because investors think this poor earnings performance will turn the corner. You'd really hope so, otherwise you're paying a pretty hefty price for no particular reason.
Check out our latest analysis for Vestum
Does Growth Match The High P/E?
Vestum's P/E ratio would be typical for a company that's expected to deliver very strong growth, and importantly, perform much better than the market.
Retrospectively, the last year delivered a frustrating 22% decrease to the company's bottom line. This has erased any of its gains during the last three years, with practically no change in EPS being achieved in total. Accordingly, shareholders probably wouldn't have been overly satisfied with the unstable medium-term growth rates.
Shifting to the future, estimates from the dual analysts covering the company suggest earnings growth is heading into negative territory, declining 54% over the next year. With the market predicted to deliver 19% growth , that's a disappointing outcome.
With this information, we find it concerning that Vestum is trading at a P/E higher than the market. It seems most investors are hoping for a turnaround in the company's business prospects, but the analyst cohort is not so confident this will happen. Only the boldest would assume these prices are sustainable as these declining earnings are likely to weigh heavily on the share price eventually.
What We Can Learn From Vestum's P/E?
The strong share price surge has got Vestum's P/E rushing to great heights as well. We'd say the price-to-earnings ratio's power isn't primarily as a valuation instrument but rather to gauge current investor sentiment and future expectations.
We've established that Vestum currently trades on a much higher than expected P/E for a company whose earnings are forecast to decline. When we see a poor outlook with earnings heading backwards, we suspect the share price is at risk of declining, sending the high P/E lower. This places shareholders' investments at significant risk and potential investors in danger of paying an excessive premium.
You need to take note of risks, for example - Vestum has 4 warning signs (and 1 which makes us a bit uncomfortable) we think you should know about.
You might be able to find a better investment than Vestum. If you want a selection of possible candidates, check out this free list of interesting companies that trade on a low P/E (but have proven they can grow earnings).
New: Manage All Your Stock Portfolios in One Place
We've created the ultimate portfolio companion for stock investors, and it's free.
• Connect an unlimited number of Portfolios and see your total in one currency
• Be alerted to new Warning Signs or Risks via email or mobile
• Track the Fair Value of your stocks
Have feedback on this article? Concerned about the content? Get in touch with us directly. Alternatively, email editorial-team (at) simplywallst.com.
This article by Simply Wall St is general in nature. We provide commentary based on historical data and analyst forecasts only using an unbiased methodology and our articles are not intended to be financial advice. It does not constitute a recommendation to buy or sell any stock, and does not take account of your objectives, or your financial situation. We aim to bring you long-term focused analysis driven by fundamental data. Note that our analysis may not factor in the latest price-sensitive company announcements or qualitative material. Simply Wall St has no position in any stocks mentioned.
About OM:VESTUM
Vestum
Engages in the infrastructure, water, and service businesses in Sweden and internationally.
Undervalued with excellent balance sheet.
Market Insights

Community Narratives

