
Advertisement
Troax Group AB (publ)'s (STO:TROAX) Recent Stock Performance Looks Decent- Can Strong Fundamentals Be the Reason?
Troax Group's (STO:TROAX) stock up by 9.1% over the past three months. Given that the market rewards strong financials in the long-term, we wonder if that is the case in this instance. Specifically, we decided to study Troax Group's ROE in this article.
ROE or return on equity is a useful tool to assess how effectively a company can generate returns on the investment it received from its shareholders. In simpler terms, it measures the profitability of a company in relation to shareholder's equity.
Check out our latest analysis for Troax Group
How Do You Calculate Return On Equity?
Return on equity can be calculated by using the formula:
Return on Equity = Net Profit (from continuing operations) ÷ Shareholders' Equity
So, based on the above formula, the ROE for Troax Group is:
19% = €34m ÷ €174m (Based on the trailing twelve months to March 2024).
The 'return' is the amount earned after tax over the last twelve months. One way to conceptualize this is that for each SEK1 of shareholders' capital it has, the company made SEK0.19 in profit.
What Has ROE Got To Do With Earnings Growth?
Thus far, we have learned that ROE measures how efficiently a company is generating its profits. Based on how much of its profits the company chooses to reinvest or "retain", we are then able to evaluate a company's future ability to generate profits. Assuming all else is equal, companies that have both a higher return on equity and higher profit retention are usually the ones that have a higher growth rate when compared to companies that don't have the same features.
Troax Group's Earnings Growth And 19% ROE
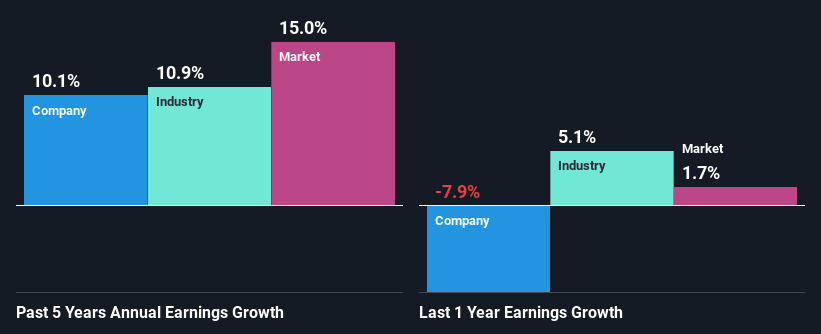
To begin with, Troax Group seems to have a respectable ROE. Especially when compared to the industry average of 15% the company's ROE looks pretty impressive. This probably laid the ground for Troax Group's moderate 10% net income growth seen over the past five years.
As a next step, we compared Troax Group's net income growth with the industry and found that the company has a similar growth figure when compared with the industry average growth rate of 11% in the same period.
The basis for attaching value to a company is, to a great extent, tied to its earnings growth. It’s important for an investor to know whether the market has priced in the company's expected earnings growth (or decline). By doing so, they will have an idea if the stock is headed into clear blue waters or if swampy waters await. Is Troax Group fairly valued compared to other companies? These 3 valuation measures might help you decide.
Is Troax Group Using Its Retained Earnings Effectively?
With a three-year median payout ratio of 47% (implying that the company retains 53% of its profits), it seems that Troax Group is reinvesting efficiently in a way that it sees respectable amount growth in its earnings and pays a dividend that's well covered.
Additionally, Troax Group has paid dividends over a period of eight years which means that the company is pretty serious about sharing its profits with shareholders. Upon studying the latest analysts' consensus data, we found that the company is expected to keep paying out approximately 49% of its profits over the next three years. Therefore, the company's future ROE is also not expected to change by much with analysts predicting an ROE of 22%.
Conclusion
In total, we are pretty happy with Troax Group's performance. Specifically, we like that the company is reinvesting a huge chunk of its profits at a high rate of return. This of course has caused the company to see substantial growth in its earnings. That being so, the latest analyst forecasts show that the company will continue to see an expansion in its earnings. To know more about the company's future earnings growth forecasts take a look at this free report on analyst forecasts for the company to find out more.
Valuation is complex, but we're here to simplify it.
Discover if Troax Group might be undervalued or overvalued with our detailed analysis, featuring fair value estimates, potential risks, dividends, insider trades, and its financial condition.
Access Free AnalysisHave feedback on this article? Concerned about the content? Get in touch with us directly. Alternatively, email editorial-team (at) simplywallst.com.
This article by Simply Wall St is general in nature. We provide commentary based on historical data and analyst forecasts only using an unbiased methodology and our articles are not intended to be financial advice. It does not constitute a recommendation to buy or sell any stock, and does not take account of your objectives, or your financial situation. We aim to bring you long-term focused analysis driven by fundamental data. Note that our analysis may not factor in the latest price-sensitive company announcements or qualitative material. Simply Wall St has no position in any stocks mentioned.
Have feedback on this article? Concerned about the content? Get in touch with us directly. Alternatively, email editorial-team@simplywallst.com
About OM:TROAX
Troax Group
Through its subsidiaries, produces and sells mesh panels in the Nordic region, the United Kingdom, North America, Europe, and internationally.
Flawless balance sheet with high growth potential.
Similar Companies
Market Insights

Advertisement
Weekly Picks
WO

woodworthfund on MGP Ingredients ·
THE KINGDOM OF BROWN GOODS: WHY MGPI IS BEING CRUSHED BY INVENTORY & PRIMED FOR RESURRECTION
Fair Value:US$4034.1% undervalued
16 followersusers have followed this narrative
1 commentusers have commented on this narrative
4 likesusers have liked this narrative
DO


Double_Bubbler on Vertical Aerospace ·
Why Vertical Aerospace (NYSE: EVTL) is Worth Possibly Over 13x its Current Price
Fair Value:US$6090.0% undervalued
21 followersusers have followed this narrative
1 commentusers have commented on this narrative
15 likesusers have liked this narrative
TI


TickerTickle on Oracle ·
The Quiet Giant That Became AI’s Power Grid
Fair Value:US$389.8142.7% undervalued
32 followersusers have followed this narrative
2 commentsusers have commented on this narrative
8 likesusers have liked this narrative
Recently Updated Narratives
MA


MarkoVT on ANYCOLOR ·
Near zero debt, Japan centric focus provides future growth
Fair Value:JP¥7.11k18.9% undervalued
1 followerusers have followed this narrative
0 commentsusers have commented on this narrative
0 likesusers have liked this narrative
LE

lexdrew1 on GE Vernova ·
GE Vernova revenue will grow by 13% with a future PE of 64.7x
Fair Value:US$824.5724.2% undervalued
8 followersusers have followed this narrative
0 commentsusers have commented on this narrative
0 likesusers have liked this narrative
GI

Gil263 on Butterfly Network ·
A buy recommendation
Fair Value:US$1.869.4% overvalued
2 followersusers have followed this narrative
1 commentusers have commented on this narrative
0 likesusers have liked this narrative
Popular Narratives
TH


TheWallstreetKing on MicroVision ·
MicroVision will explode future revenue by 380.37% with a vision towards success
Fair Value:US$6098.4% undervalued
119 followersusers have followed this narrative
11 commentsusers have commented on this narrative
22 likesusers have liked this narrative
AN


AnalystConsensusTarget on NVIDIA ·
NVDA: Expanding AI Demand Will Drive Major Data Center Investments Through 2026
Fair Value:US$250.3926.7% undervalued
963 followersusers have followed this narrative
6 commentsusers have commented on this narrative
25 likesusers have liked this narrative
RO


RockeTeller on Santacruz Silver Mining ·
Crazy Undervalued 42 Baggers Silver Play (Active & Running Mine)
Fair Value:CA$8684.3% undervalued
76 followersusers have followed this narrative
8 commentsusers have commented on this narrative
21 likesusers have liked this narrative
