

Some say volatility, rather than debt, is the best way to think about risk as an investor, but Warren Buffett famously said that 'Volatility is far from synonymous with risk.' So it might be obvious that you need to consider debt, when you think about how risky any given stock is, because too much debt can sink a company. Importantly, Trelleborg AB (publ) (STO:TREL B) does carry debt. But is this debt a concern to shareholders?
When Is Debt Dangerous?
Debt assists a business until the business has trouble paying it off, either with new capital or with free cash flow. In the worst case scenario, a company can go bankrupt if it cannot pay its creditors. However, a more common (but still painful) scenario is that it has to raise new equity capital at a low price, thus permanently diluting shareholders. Of course, debt can be an important tool in businesses, particularly capital heavy businesses. When we examine debt levels, we first consider both cash and debt levels, together.
See our latest analysis for Trelleborg
How Much Debt Does Trelleborg Carry?
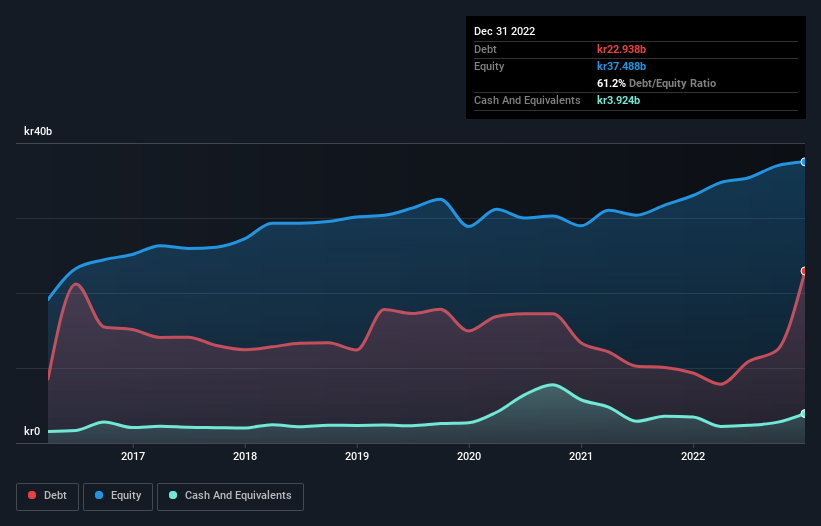
You can click the graphic below for the historical numbers, but it shows that as of December 2022 Trelleborg had kr22.9b of debt, an increase on kr9.33b, over one year. However, because it has a cash reserve of kr3.92b, its net debt is less, at about kr19.0b.
How Healthy Is Trelleborg's Balance Sheet?
Zooming in on the latest balance sheet data, we can see that Trelleborg had liabilities of kr28.9b due within 12 months and liabilities of kr10.7b due beyond that. Offsetting this, it had kr3.92b in cash and kr8.12b in receivables that were due within 12 months. So its liabilities total kr27.5b more than the combination of its cash and short-term receivables.
This deficit isn't so bad because Trelleborg is worth kr69.3b, and thus could probably raise enough capital to shore up its balance sheet, if the need arose. But we definitely want to keep our eyes open to indications that its debt is bringing too much risk.
We use two main ratios to inform us about debt levels relative to earnings. The first is net debt divided by earnings before interest, tax, depreciation, and amortization (EBITDA), while the second is how many times its earnings before interest and tax (EBIT) covers its interest expense (or its interest cover, for short). The advantage of this approach is that we take into account both the absolute quantum of debt (with net debt to EBITDA) and the actual interest expenses associated with that debt (with its interest cover ratio).
Trelleborg's net debt is 3.1 times its EBITDA, which is a significant but still reasonable amount of leverage. But its EBIT was about 22.0 times its interest expense, implying the company isn't really paying a high cost to maintain that level of debt. Even were the low cost to prove unsustainable, that is a good sign. Importantly Trelleborg's EBIT was essentially flat over the last twelve months. We would prefer to see some earnings growth, because that always helps diminish debt. There's no doubt that we learn most about debt from the balance sheet. But ultimately the future profitability of the business will decide if Trelleborg can strengthen its balance sheet over time. So if you want to see what the professionals think, you might find this free report on analyst profit forecasts to be interesting.
But our final consideration is also important, because a company cannot pay debt with paper profits; it needs cold hard cash. So we always check how much of that EBIT is translated into free cash flow. Happily for any shareholders, Trelleborg actually produced more free cash flow than EBIT over the last three years. That sort of strong cash generation warms our hearts like a puppy in a bumblebee suit.
Our View
Happily, Trelleborg's impressive interest cover implies it has the upper hand on its debt. But truth be told we feel its net debt to EBITDA does undermine this impression a bit. All these things considered, it appears that Trelleborg can comfortably handle its current debt levels. Of course, while this leverage can enhance returns on equity, it does bring more risk, so it's worth keeping an eye on this one. There's no doubt that we learn most about debt from the balance sheet. However, not all investment risk resides within the balance sheet - far from it. These risks can be hard to spot. Every company has them, and we've spotted 3 warning signs for Trelleborg you should know about.
Of course, if you're the type of investor who prefers buying stocks without the burden of debt, then don't hesitate to discover our exclusive list of net cash growth stocks, today.
If you're looking to trade Trelleborg, open an account with the lowest-cost platform trusted by professionals, Interactive Brokers.
With clients in over 200 countries and territories, and access to 160 markets, IBKR lets you trade stocks, options, futures, forex, bonds and funds from a single integrated account.
Enjoy no hidden fees, no account minimums, and FX conversion rates as low as 0.03%, far better than what most brokers offer.
Sponsored ContentValuation is complex, but we're here to simplify it.
Discover if Trelleborg might be undervalued or overvalued with our detailed analysis, featuring fair value estimates, potential risks, dividends, insider trades, and its financial condition.
Access Free AnalysisHave feedback on this article? Concerned about the content? Get in touch with us directly. Alternatively, email editorial-team (at) simplywallst.com.
This article by Simply Wall St is general in nature. We provide commentary based on historical data and analyst forecasts only using an unbiased methodology and our articles are not intended to be financial advice. It does not constitute a recommendation to buy or sell any stock, and does not take account of your objectives, or your financial situation. We aim to bring you long-term focused analysis driven by fundamental data. Note that our analysis may not factor in the latest price-sensitive company announcements or qualitative material. Simply Wall St has no position in any stocks mentioned.
About OM:TREL B
Trelleborg
Provides engineered polymer solutions for seal, damp, and protect critical applications worldwide.
Flawless balance sheet, good value and pays a dividend.

