
Advertisement
Warren Buffett famously said, 'Volatility is far from synonymous with risk.' When we think about how risky a company is, we always like to look at its use of debt, since debt overload can lead to ruin. We note that Teqnion AB (publ) (STO:TEQ) does have debt on its balance sheet. But is this debt a concern to shareholders?
When Is Debt A Problem?
Debt assists a business until the business has trouble paying it off, either with new capital or with free cash flow. Ultimately, if the company can't fulfill its legal obligations to repay debt, shareholders could walk away with nothing. While that is not too common, we often do see indebted companies permanently diluting shareholders because lenders force them to raise capital at a distressed price. Of course, the upside of debt is that it often represents cheap capital, especially when it replaces dilution in a company with the ability to reinvest at high rates of return. When we examine debt levels, we first consider both cash and debt levels, together.
View our latest analysis for Teqnion
What Is Teqnion's Net Debt?
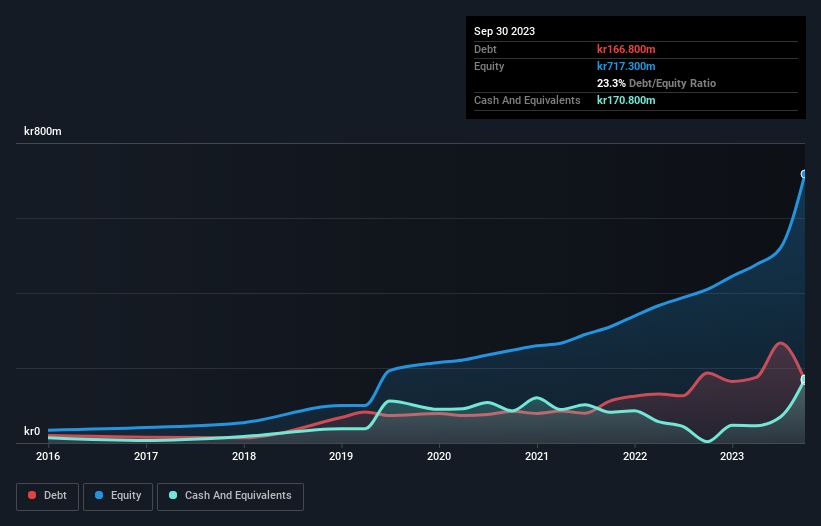
The image below, which you can click on for greater detail, shows that Teqnion had debt of kr166.8m at the end of September 2023, a reduction from kr186.4m over a year. However, it does have kr170.8m in cash offsetting this, leading to net cash of kr4.00m.
How Healthy Is Teqnion's Balance Sheet?
The latest balance sheet data shows that Teqnion had liabilities of kr509.8m due within a year, and liabilities of kr170.2m falling due after that. Offsetting these obligations, it had cash of kr170.8m as well as receivables valued at kr255.9m due within 12 months. So it has liabilities totalling kr253.3m more than its cash and near-term receivables, combined.
Given Teqnion has a market capitalization of kr4.09b, it's hard to believe these liabilities pose much threat. Having said that, it's clear that we should continue to monitor its balance sheet, lest it change for the worse. While it does have liabilities worth noting, Teqnion also has more cash than debt, so we're pretty confident it can manage its debt safely.
Also positive, Teqnion grew its EBIT by 26% in the last year, and that should make it easier to pay down debt, going forward. The balance sheet is clearly the area to focus on when you are analysing debt. But you can't view debt in total isolation; since Teqnion will need earnings to service that debt. So when considering debt, it's definitely worth looking at the earnings trend. Click here for an interactive snapshot.
Finally, a business needs free cash flow to pay off debt; accounting profits just don't cut it. Teqnion may have net cash on the balance sheet, but it is still interesting to look at how well the business converts its earnings before interest and tax (EBIT) to free cash flow, because that will influence both its need for, and its capacity to manage debt. During the last three years, Teqnion generated free cash flow amounting to a very robust 84% of its EBIT, more than we'd expect. That puts it in a very strong position to pay down debt.
Summing Up
While it is always sensible to look at a company's total liabilities, it is very reassuring that Teqnion has kr4.00m in net cash. And it impressed us with free cash flow of kr113m, being 84% of its EBIT. So we don't think Teqnion's use of debt is risky. There's no doubt that we learn most about debt from the balance sheet. However, not all investment risk resides within the balance sheet - far from it. We've identified 1 warning sign with Teqnion , and understanding them should be part of your investment process.
At the end of the day, it's often better to focus on companies that are free from net debt. You can access our special list of such companies (all with a track record of profit growth). It's free.
Valuation is complex, but we're here to simplify it.
Discover if Teqnion might be undervalued or overvalued with our detailed analysis, featuring fair value estimates, potential risks, dividends, insider trades, and its financial condition.
Access Free AnalysisHave feedback on this article? Concerned about the content? Get in touch with us directly. Alternatively, email editorial-team (at) simplywallst.com.
This article by Simply Wall St is general in nature. We provide commentary based on historical data and analyst forecasts only using an unbiased methodology and our articles are not intended to be financial advice. It does not constitute a recommendation to buy or sell any stock, and does not take account of your objectives, or your financial situation. We aim to bring you long-term focused analysis driven by fundamental data. Note that our analysis may not factor in the latest price-sensitive company announcements or qualitative material. Simply Wall St has no position in any stocks mentioned.
About OM:TEQ
Teqnion
A diversified industrial company, provides a range of products in selected niche markets.
Excellent balance sheet and overvalued.
Market Insights

Advertisement
Community Narratives
The Next Phase of Energy Storage: How NeoVolta Is Tackling America’s Power Crunch
Fair Value US$7.50|35.1% undervalued
MA
Community Contributor
Why EnSilica is Worth Possibly 13x its Current Price
Fair Value UK£5.00|89.8% undervalued
DO
Community Contributor
M&A Activity, Industry Diversification & A Defense Contract Monopoly Will Push BWXT For Healthy Long-Term Growth
Fair Value US$220.00|15.2% undervalued
CL
Community Contributor
A case for Cassiar Gold Corp (TSXV: GLDC) to reach CAD$8-10 before 2030 (X30-37)
Fair Value CA$10.00|96.0% undervalued
AG
Community Contributor