- Sweden
- /
- Trade Distributors
- /
- OM:TEQ
These 4 Measures Indicate That Teqnion (STO:TEQ) Is Using Debt Reasonably Well
Warren Buffett famously said, 'Volatility is far from synonymous with risk.' So it might be obvious that you need to consider debt, when you think about how risky any given stock is, because too much debt can sink a company. Importantly, Teqnion AB (publ) (STO:TEQ) does carry debt. But is this debt a concern to shareholders?
What Risk Does Debt Bring?
Debt is a tool to help businesses grow, but if a business is incapable of paying off its lenders, then it exists at their mercy. Ultimately, if the company can't fulfill its legal obligations to repay debt, shareholders could walk away with nothing. However, a more usual (but still expensive) situation is where a company must dilute shareholders at a cheap share price simply to get debt under control. Of course, debt can be an important tool in businesses, particularly capital heavy businesses. When we examine debt levels, we first consider both cash and debt levels, together.
View our latest analysis for Teqnion
What Is Teqnion's Debt?
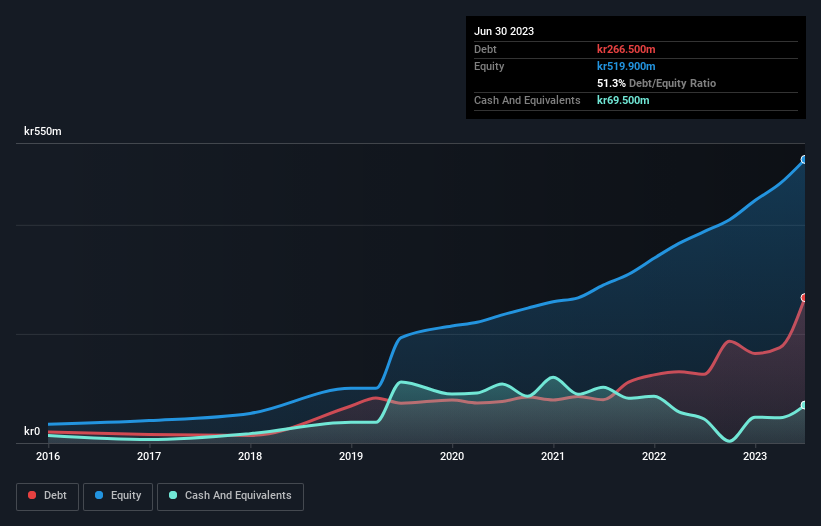
The image below, which you can click on for greater detail, shows that at June 2023 Teqnion had debt of kr266.5m, up from kr126.0m in one year. However, it also had kr69.5m in cash, and so its net debt is kr197.0m.

A Look At Teqnion's Liabilities
Zooming in on the latest balance sheet data, we can see that Teqnion had liabilities of kr450.6m due within 12 months and liabilities of kr323.2m due beyond that. Offsetting this, it had kr69.5m in cash and kr269.4m in receivables that were due within 12 months. So its liabilities outweigh the sum of its cash and (near-term) receivables by kr434.9m.
Since publicly traded Teqnion shares are worth a total of kr4.34b, it seems unlikely that this level of liabilities would be a major threat. However, we do think it is worth keeping an eye on its balance sheet strength, as it may change over time.
We measure a company's debt load relative to its earnings power by looking at its net debt divided by its earnings before interest, tax, depreciation, and amortization (EBITDA) and by calculating how easily its earnings before interest and tax (EBIT) cover its interest expense (interest cover). This way, we consider both the absolute quantum of the debt, as well as the interest rates paid on it.
With net debt sitting at just 1.2 times EBITDA, Teqnion is arguably pretty conservatively geared. And it boasts interest cover of 8.5 times, which is more than adequate. Also good is that Teqnion grew its EBIT at 16% over the last year, further increasing its ability to manage debt. The balance sheet is clearly the area to focus on when you are analysing debt. But it is Teqnion's earnings that will influence how the balance sheet holds up in the future. So when considering debt, it's definitely worth looking at the earnings trend. Click here for an interactive snapshot.
Finally, while the tax-man may adore accounting profits, lenders only accept cold hard cash. So we always check how much of that EBIT is translated into free cash flow. During the last three years, Teqnion generated free cash flow amounting to a very robust 86% of its EBIT, more than we'd expect. That puts it in a very strong position to pay down debt.
Our View
The good news is that Teqnion's demonstrated ability to convert EBIT to free cash flow delights us like a fluffy puppy does a toddler. And the good news does not stop there, as its EBIT growth rate also supports that impression! Zooming out, Teqnion seems to use debt quite reasonably; and that gets the nod from us. After all, sensible leverage can boost returns on equity. The balance sheet is clearly the area to focus on when you are analysing debt. However, not all investment risk resides within the balance sheet - far from it. We've identified 1 warning sign with Teqnion , and understanding them should be part of your investment process.
If you're interested in investing in businesses that can grow profits without the burden of debt, then check out this free list of growing businesses that have net cash on the balance sheet.
Valuation is complex, but we're here to simplify it.
Discover if Teqnion might be undervalued or overvalued with our detailed analysis, featuring fair value estimates, potential risks, dividends, insider trades, and its financial condition.
Access Free AnalysisHave feedback on this article? Concerned about the content? Get in touch with us directly. Alternatively, email editorial-team (at) simplywallst.com.
This article by Simply Wall St is general in nature. We provide commentary based on historical data and analyst forecasts only using an unbiased methodology and our articles are not intended to be financial advice. It does not constitute a recommendation to buy or sell any stock, and does not take account of your objectives, or your financial situation. We aim to bring you long-term focused analysis driven by fundamental data. Note that our analysis may not factor in the latest price-sensitive company announcements or qualitative material. Simply Wall St has no position in any stocks mentioned.
About OM:TEQ
Teqnion
A diversified industrial company, provides a range of products in selected niche markets.
Excellent balance sheet and overvalued.
Market Insights
Community Narratives


