
Advertisement
Some say volatility, rather than debt, is the best way to think about risk as an investor, but Warren Buffett famously said that 'Volatility is far from synonymous with risk.' When we think about how risky a company is, we always like to look at its use of debt, since debt overload can lead to ruin. We can see that Teqnion AB (publ) (STO:TEQ) does use debt in its business. But should shareholders be worried about its use of debt?
When Is Debt Dangerous?
Debt assists a business until the business has trouble paying it off, either with new capital or with free cash flow. Part and parcel of capitalism is the process of 'creative destruction' where failed businesses are mercilessly liquidated by their bankers. While that is not too common, we often do see indebted companies permanently diluting shareholders because lenders force them to raise capital at a distressed price. Of course, debt can be an important tool in businesses, particularly capital heavy businesses. When we think about a company's use of debt, we first look at cash and debt together.
Check out our latest analysis for Teqnion
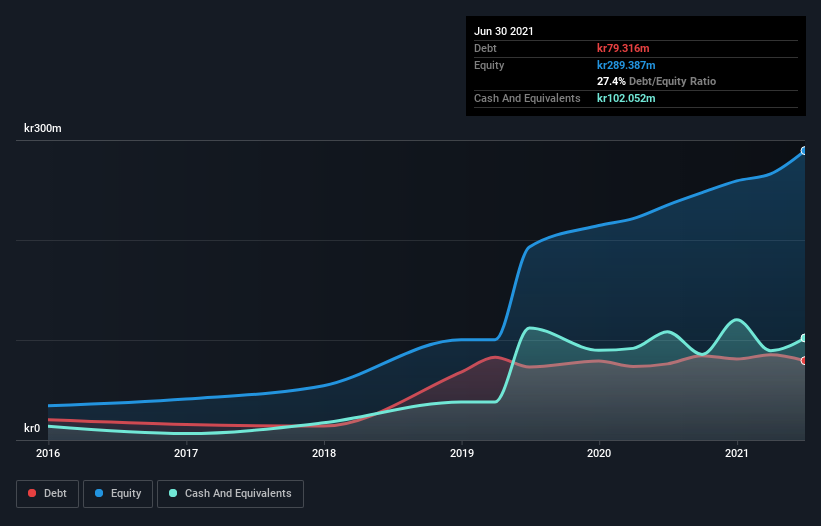
What Is Teqnion's Debt?
As you can see below, at the end of June 2021, Teqnion had kr79.3m of debt, up from kr76.1m a year ago. Click the image for more detail. But it also has kr102.1m in cash to offset that, meaning it has kr22.7m net cash.
A Look At Teqnion's Liabilities
The latest balance sheet data shows that Teqnion had liabilities of kr209.9m due within a year, and liabilities of kr139.2m falling due after that. On the other hand, it had cash of kr102.1m and kr124.6m worth of receivables due within a year. So it has liabilities totalling kr122.5m more than its cash and near-term receivables, combined.
Given Teqnion has a market capitalization of kr1.39b, it's hard to believe these liabilities pose much threat. However, we do think it is worth keeping an eye on its balance sheet strength, as it may change over time. Despite its noteworthy liabilities, Teqnion boasts net cash, so it's fair to say it does not have a heavy debt load!
In addition to that, we're happy to report that Teqnion has boosted its EBIT by 95%, thus reducing the spectre of future debt repayments. The balance sheet is clearly the area to focus on when you are analysing debt. But you can't view debt in total isolation; since Teqnion will need earnings to service that debt. So when considering debt, it's definitely worth looking at the earnings trend. Click here for an interactive snapshot.
Finally, while the tax-man may adore accounting profits, lenders only accept cold hard cash. While Teqnion has net cash on its balance sheet, it's still worth taking a look at its ability to convert earnings before interest and tax (EBIT) to free cash flow, to help us understand how quickly it is building (or eroding) that cash balance. Over the last three years, Teqnion actually produced more free cash flow than EBIT. That sort of strong cash generation warms our hearts like a puppy in a bumblebee suit.
Summing up
We could understand if investors are concerned about Teqnion's liabilities, but we can be reassured by the fact it has has net cash of kr22.7m. The cherry on top was that in converted 135% of that EBIT to free cash flow, bringing in kr115m. So is Teqnion's debt a risk? It doesn't seem so to us. There's no doubt that we learn most about debt from the balance sheet. However, not all investment risk resides within the balance sheet - far from it. Be aware that Teqnion is showing 1 warning sign in our investment analysis , you should know about...
Of course, if you're the type of investor who prefers buying stocks without the burden of debt, then don't hesitate to discover our exclusive list of net cash growth stocks, today.
Valuation is complex, but we're here to simplify it.
Discover if Teqnion might be undervalued or overvalued with our detailed analysis, featuring fair value estimates, potential risks, dividends, insider trades, and its financial condition.
Access Free AnalysisThis article by Simply Wall St is general in nature. We provide commentary based on historical data and analyst forecasts only using an unbiased methodology and our articles are not intended to be financial advice. It does not constitute a recommendation to buy or sell any stock, and does not take account of your objectives, or your financial situation. We aim to bring you long-term focused analysis driven by fundamental data. Note that our analysis may not factor in the latest price-sensitive company announcements or qualitative material. Simply Wall St has no position in any stocks mentioned.
Have feedback on this article? Concerned about the content? Get in touch with us directly. Alternatively, email editorial-team (at) simplywallst.com.
About OM:TEQ
Teqnion
A diversified industrial company, provides a range of products in selected niche markets.
Excellent balance sheet and overvalued.
Market Insights

Advertisement
Community Narratives
The Next Phase of Energy Storage: How NeoVolta Is Tackling America’s Power Crunch
Fair Value US$7.50|35.1% undervalued
MA
Community Contributor
Why EnSilica is Worth Possibly 13x its Current Price
Fair Value UK£5.00|89.8% undervalued
DO
Community Contributor
M&A Activity, Industry Diversification & A Defense Contract Monopoly Will Push BWXT For Healthy Long-Term Growth
Fair Value US$220.00|15.2% undervalued
CL
Community Contributor
A case for Cassiar Gold Corp (TSXV: GLDC) to reach CAD$8-10 before 2030 (X30-37)
Fair Value CA$10.00|96.0% undervalued
AG
Community Contributor