

If you're looking for a multi-bagger, there's a few things to keep an eye out for. Firstly, we'd want to identify a growing return on capital employed (ROCE) and then alongside that, an ever-increasing base of capital employed. Basically this means that a company has profitable initiatives that it can continue to reinvest in, which is a trait of a compounding machine. So while OX2 (STO:OX2) has a high ROCE right now, lets see what we can decipher from how returns are changing.
Return On Capital Employed (ROCE): What Is It?
For those that aren't sure what ROCE is, it measures the amount of pre-tax profits a company can generate from the capital employed in its business. The formula for this calculation on OX2 is:
Return on Capital Employed = Earnings Before Interest and Tax (EBIT) ÷ (Total Assets - Current Liabilities)
0.33 = kr1.4b ÷ (kr7.4b - kr3.0b) (Based on the trailing twelve months to September 2023).
Therefore, OX2 has an ROCE of 33%. In absolute terms that's a great return and it's even better than the Construction industry average of 9.7%.
See our latest analysis for OX2
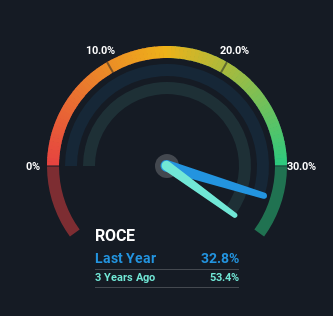
In the above chart we have measured OX2's prior ROCE against its prior performance, but the future is arguably more important. If you'd like to see what analysts are forecasting going forward, you should check out our free report for OX2.
What The Trend Of ROCE Can Tell Us
When we looked at the ROCE trend at OX2, we didn't gain much confidence. Historically returns on capital were even higher at 59%, but they have dropped over the last four years. However it looks like OX2 might be reinvesting for long term growth because while capital employed has increased, the company's sales haven't changed much in the last 12 months. It may take some time before the company starts to see any change in earnings from these investments.
On a related note, OX2 has decreased its current liabilities to 41% of total assets. So we could link some of this to the decrease in ROCE. Effectively this means their suppliers or short-term creditors are funding less of the business, which reduces some elements of risk. Since the business is basically funding more of its operations with it's own money, you could argue this has made the business less efficient at generating ROCE. Either way, they're still at a pretty high level, so we'd like to see them fall further if possible.
What We Can Learn From OX2's ROCE
In summary, OX2 is reinvesting funds back into the business for growth but unfortunately it looks like sales haven't increased much just yet. Since the stock has declined 30% over the last year, investors may not be too optimistic on this trend improving either. Therefore based on the analysis done in this article, we don't think OX2 has the makings of a multi-bagger.
If you're still interested in OX2 it's worth checking out our FREE intrinsic value approximation to see if it's trading at an attractive price in other respects.
OX2 is not the only stock earning high returns. If you'd like to see more, check out our free list of companies earning high returns on equity with solid fundamentals.
New: AI Stock Screener & Alerts
Our new AI Stock Screener scans the market every day to uncover opportunities.
• Dividend Powerhouses (3%+ Yield)
• Undervalued Small Caps with Insider Buying
• High growth Tech and AI Companies
Or build your own from over 50 metrics.
Have feedback on this article? Concerned about the content? Get in touch with us directly. Alternatively, email editorial-team (at) simplywallst.com.
This article by Simply Wall St is general in nature. We provide commentary based on historical data and analyst forecasts only using an unbiased methodology and our articles are not intended to be financial advice. It does not constitute a recommendation to buy or sell any stock, and does not take account of your objectives, or your financial situation. We aim to bring you long-term focused analysis driven by fundamental data. Note that our analysis may not factor in the latest price-sensitive company announcements or qualitative material. Simply Wall St has no position in any stocks mentioned.
About OM:OX2
Flawless balance sheet and slightly overvalued.
Similar Companies
Market Insights

Community Narratives


