- Sweden
- /
- Electrical
- /
- OM:FERRO
Despite Lacking Profits Ferroamp (STO:FERRO) Seems To Be On Top Of Its Debt


Warren Buffett famously said, 'Volatility is far from synonymous with risk.' When we think about how risky a company is, we always like to look at its use of debt, since debt overload can lead to ruin. We note that Ferroamp AB (publ) (STO:FERRO) does have debt on its balance sheet. But the more important question is: how much risk is that debt creating?
What Risk Does Debt Bring?
Debt is a tool to help businesses grow, but if a business is incapable of paying off its lenders, then it exists at their mercy. If things get really bad, the lenders can take control of the business. While that is not too common, we often do see indebted companies permanently diluting shareholders because lenders force them to raise capital at a distressed price. Of course, debt can be an important tool in businesses, particularly capital heavy businesses. The first thing to do when considering how much debt a business uses is to look at its cash and debt together.
View our latest analysis for Ferroamp
How Much Debt Does Ferroamp Carry?
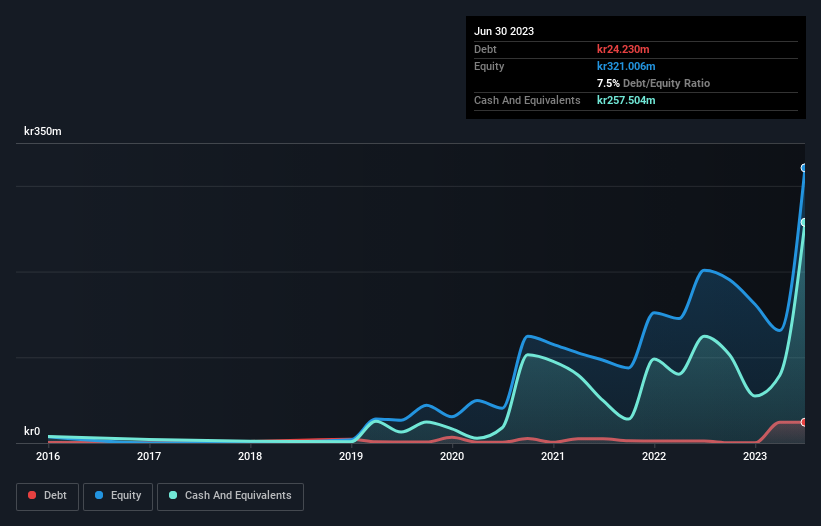
You can click the graphic below for the historical numbers, but it shows that as of June 2023 Ferroamp had kr24.2m of debt, an increase on kr2.29m, over one year. But it also has kr257.5m in cash to offset that, meaning it has kr233.3m net cash.
How Strong Is Ferroamp's Balance Sheet?
Zooming in on the latest balance sheet data, we can see that Ferroamp had liabilities of kr124.9m due within 12 months and liabilities of kr592.0k due beyond that. On the other hand, it had cash of kr257.5m and kr38.9m worth of receivables due within a year. So it can boast kr171.0m more liquid assets than total liabilities.
This excess liquidity is a great indication that Ferroamp's balance sheet is almost as strong as Fort Knox. On this view, lenders should feel as safe as the beloved of a black-belt karate master. Simply put, the fact that Ferroamp has more cash than debt is arguably a good indication that it can manage its debt safely. When analysing debt levels, the balance sheet is the obvious place to start. But ultimately the future profitability of the business will decide if Ferroamp can strengthen its balance sheet over time. So if you want to see what the professionals think, you might find this free report on analyst profit forecasts to be interesting.
Over 12 months, Ferroamp reported revenue of kr400m, which is a gain of 121%, although it did not report any earnings before interest and tax. So its pretty obvious shareholders are hoping for more growth!
So How Risky Is Ferroamp?
We have no doubt that loss making companies are, in general, riskier than profitable ones. And the fact is that over the last twelve months Ferroamp lost money at the earnings before interest and tax (EBIT) line. And over the same period it saw negative free cash outflow of kr157m and booked a kr78m accounting loss. Given it only has net cash of kr233.3m, the company may need to raise more capital if it doesn't reach break-even soon. The good news for shareholders is that Ferroamp has dazzling revenue growth, so there's a very good chance it can boost its free cash flow in the years to come. While unprofitable companies can be risky, they can also grow hard and fast in those pre-profit years. The balance sheet is clearly the area to focus on when you are analysing debt. However, not all investment risk resides within the balance sheet - far from it. Be aware that Ferroamp is showing 4 warning signs in our investment analysis , and 2 of those shouldn't be ignored...
At the end of the day, it's often better to focus on companies that are free from net debt. You can access our special list of such companies (all with a track record of profit growth). It's free.
If you're looking to trade Ferroamp, open an account with the lowest-cost platform trusted by professionals, Interactive Brokers.
With clients in over 200 countries and territories, and access to 160 markets, IBKR lets you trade stocks, options, futures, forex, bonds and funds from a single integrated account.
Enjoy no hidden fees, no account minimums, and FX conversion rates as low as 0.03%, far better than what most brokers offer.
Sponsored ContentNew: AI Stock Screener & Alerts
Our new AI Stock Screener scans the market every day to uncover opportunities.
• Dividend Powerhouses (3%+ Yield)
• Undervalued Small Caps with Insider Buying
• High growth Tech and AI Companies
Or build your own from over 50 metrics.
Have feedback on this article? Concerned about the content? Get in touch with us directly. Alternatively, email editorial-team (at) simplywallst.com.
This article by Simply Wall St is general in nature. We provide commentary based on historical data and analyst forecasts only using an unbiased methodology and our articles are not intended to be financial advice. It does not constitute a recommendation to buy or sell any stock, and does not take account of your objectives, or your financial situation. We aim to bring you long-term focused analysis driven by fundamental data. Note that our analysis may not factor in the latest price-sensitive company announcements or qualitative material. Simply Wall St has no position in any stocks mentioned.
About OM:FERRO
Ferroamp
Provides energy and power optimization solutions for homeowners, tenant owner associations, and property owners in Sweden.
High growth potential with excellent balance sheet.
Market Insights

Community Narratives

