

Warren Buffett famously said, 'Volatility is far from synonymous with risk.' When we think about how risky a company is, we always like to look at its use of debt, since debt overload can lead to ruin. We note that Fagerhult Group AB (STO:FAG) does have debt on its balance sheet. But is this debt a concern to shareholders?
When Is Debt A Problem?
Generally speaking, debt only becomes a real problem when a company can't easily pay it off, either by raising capital or with its own cash flow. Ultimately, if the company can't fulfill its legal obligations to repay debt, shareholders could walk away with nothing. However, a more usual (but still expensive) situation is where a company must dilute shareholders at a cheap share price simply to get debt under control. Of course, debt can be an important tool in businesses, particularly capital heavy businesses. When we examine debt levels, we first consider both cash and debt levels, together.
View our latest analysis for Fagerhult Group
What Is Fagerhult Group's Debt?
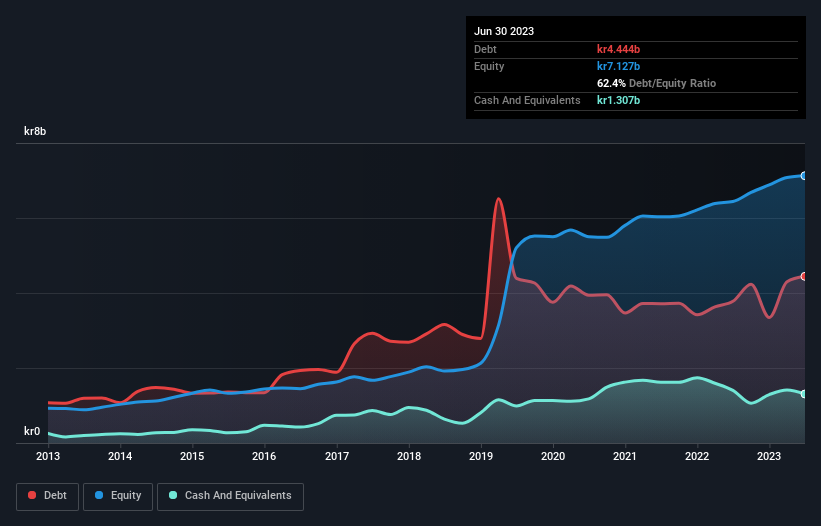
You can click the graphic below for the historical numbers, but it shows that as of June 2023 Fagerhult Group had kr4.44b of debt, an increase on kr3.78b, over one year. However, it does have kr1.31b in cash offsetting this, leading to net debt of about kr3.14b.
A Look At Fagerhult Group's Liabilities
Zooming in on the latest balance sheet data, we can see that Fagerhult Group had liabilities of kr2.04b due within 12 months and liabilities of kr4.70b due beyond that. On the other hand, it had cash of kr1.31b and kr1.65b worth of receivables due within a year. So it has liabilities totalling kr3.78b more than its cash and near-term receivables, combined.
Fagerhult Group has a market capitalization of kr9.46b, so it could very likely raise cash to ameliorate its balance sheet, if the need arose. However, it is still worthwhile taking a close look at its ability to pay off debt.
We measure a company's debt load relative to its earnings power by looking at its net debt divided by its earnings before interest, tax, depreciation, and amortization (EBITDA) and by calculating how easily its earnings before interest and tax (EBIT) cover its interest expense (interest cover). Thus we consider debt relative to earnings both with and without depreciation and amortization expenses.
With net debt to EBITDA of 2.6 Fagerhult Group has a fairly noticeable amount of debt. But the high interest coverage of 9.2 suggests it can easily service that debt. It is well worth noting that Fagerhult Group's EBIT shot up like bamboo after rain, gaining 38% in the last twelve months. That'll make it easier to manage its debt. When analysing debt levels, the balance sheet is the obvious place to start. But it is Fagerhult Group's earnings that will influence how the balance sheet holds up in the future. So if you're keen to discover more about its earnings, it might be worth checking out this graph of its long term earnings trend.
But our final consideration is also important, because a company cannot pay debt with paper profits; it needs cold hard cash. So we clearly need to look at whether that EBIT is leading to corresponding free cash flow. During the last three years, Fagerhult Group generated free cash flow amounting to a very robust 95% of its EBIT, more than we'd expect. That positions it well to pay down debt if desirable to do so.
Our View
Happily, Fagerhult Group's impressive conversion of EBIT to free cash flow implies it has the upper hand on its debt. But, on a more sombre note, we are a little concerned by its net debt to EBITDA. Zooming out, Fagerhult Group seems to use debt quite reasonably; and that gets the nod from us. While debt does bring risk, when used wisely it can also bring a higher return on equity. The balance sheet is clearly the area to focus on when you are analysing debt. But ultimately, every company can contain risks that exist outside of the balance sheet. To that end, you should be aware of the 2 warning signs we've spotted with Fagerhult Group .
If, after all that, you're more interested in a fast growing company with a rock-solid balance sheet, then check out our list of net cash growth stocks without delay.
If you're looking to trade Fagerhult Group, open an account with the lowest-cost platform trusted by professionals, Interactive Brokers.
With clients in over 200 countries and territories, and access to 160 markets, IBKR lets you trade stocks, options, futures, forex, bonds and funds from a single integrated account.
Enjoy no hidden fees, no account minimums, and FX conversion rates as low as 0.03%, far better than what most brokers offer.
Sponsored ContentNew: AI Stock Screener & Alerts
Our new AI Stock Screener scans the market every day to uncover opportunities.
• Dividend Powerhouses (3%+ Yield)
• Undervalued Small Caps with Insider Buying
• High growth Tech and AI Companies
Or build your own from over 50 metrics.
Have feedback on this article? Concerned about the content? Get in touch with us directly. Alternatively, email editorial-team (at) simplywallst.com.
This article by Simply Wall St is general in nature. We provide commentary based on historical data and analyst forecasts only using an unbiased methodology and our articles are not intended to be financial advice. It does not constitute a recommendation to buy or sell any stock, and does not take account of your objectives, or your financial situation. We aim to bring you long-term focused analysis driven by fundamental data. Note that our analysis may not factor in the latest price-sensitive company announcements or qualitative material. Simply Wall St has no position in any stocks mentioned.
About OM:FAG
Fagerhult Group
Designs, manufactures, and markets professional lighting solutions worldwide.
Flawless balance sheet with reasonable growth potential and pays a dividend.
Similar Companies
Market Insights

Community Narratives

