

If we want to find a stock that could multiply over the long term, what are the underlying trends we should look for? Firstly, we'll want to see a proven return on capital employed (ROCE) that is increasing, and secondly, an expanding base of capital employed. If you see this, it typically means it's a company with a great business model and plenty of profitable reinvestment opportunities. And in light of that, the trends we're seeing at BE Group's (STO:BEGR) look very promising so lets take a look.
Return On Capital Employed (ROCE): What is it?
For those who don't know, ROCE is a measure of a company's yearly pre-tax profit (its return), relative to the capital employed in the business. The formula for this calculation on BE Group is:
Return on Capital Employed = Earnings Before Interest and Tax (EBIT) ÷ (Total Assets - Current Liabilities)
0.26 = kr556m ÷ (kr3.1b - kr969m) (Based on the trailing twelve months to December 2021).
Thus, BE Group has an ROCE of 26%. That's a fantastic return and not only that, it outpaces the average of 16% earned by companies in a similar industry.
View our latest analysis for BE Group
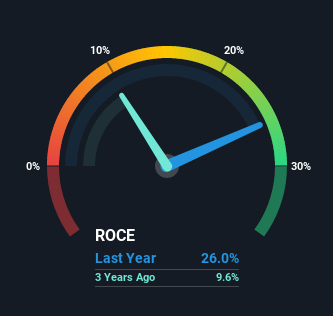
Above you can see how the current ROCE for BE Group compares to its prior returns on capital, but there's only so much you can tell from the past. If you'd like to see what analysts are forecasting going forward, you should check out our free report for BE Group.
What The Trend Of ROCE Can Tell Us
Investors would be pleased with what's happening at BE Group. The numbers show that in the last five years, the returns generated on capital employed have grown considerably to 26%. The amount of capital employed has increased too, by 59%. This can indicate that there's plenty of opportunities to invest capital internally and at ever higher rates, a combination that's common among multi-baggers.
Our Take On BE Group's ROCE
All in all, it's terrific to see that BE Group is reaping the rewards from prior investments and is growing its capital base. And a remarkable 227% total return over the last five years tells us that investors are expecting more good things to come in the future. With that being said, we still think the promising fundamentals mean the company deserves some further due diligence.
If you want to know some of the risks facing BE Group we've found 4 warning signs (2 don't sit too well with us!) that you should be aware of before investing here.
BE Group is not the only stock earning high returns. If you'd like to see more, check out our free list of companies earning high returns on equity with solid fundamentals.
If you're looking to trade BE Group, open an account with the lowest-cost platform trusted by professionals, Interactive Brokers.
With clients in over 200 countries and territories, and access to 160 markets, IBKR lets you trade stocks, options, futures, forex, bonds and funds from a single integrated account.
Enjoy no hidden fees, no account minimums, and FX conversion rates as low as 0.03%, far better than what most brokers offer.
Sponsored ContentValuation is complex, but we're here to simplify it.
Discover if BE Group might be undervalued or overvalued with our detailed analysis, featuring fair value estimates, potential risks, dividends, insider trades, and its financial condition.
Access Free AnalysisHave feedback on this article? Concerned about the content? Get in touch with us directly. Alternatively, email editorial-team (at) simplywallst.com.
This article by Simply Wall St is general in nature. We provide commentary based on historical data and analyst forecasts only using an unbiased methodology and our articles are not intended to be financial advice. It does not constitute a recommendation to buy or sell any stock, and does not take account of your objectives, or your financial situation. We aim to bring you long-term focused analysis driven by fundamental data. Note that our analysis may not factor in the latest price-sensitive company announcements or qualitative material. Simply Wall St has no position in any stocks mentioned.
About OM:BEGR
BE Group
Operates as a trading and service company in steel, stainless steel, and aluminum products in Sweden, Poland, Finland, and Baltics.
Adequate balance sheet and slightly overvalued.
Similar Companies
Market Insights

Community Narratives

